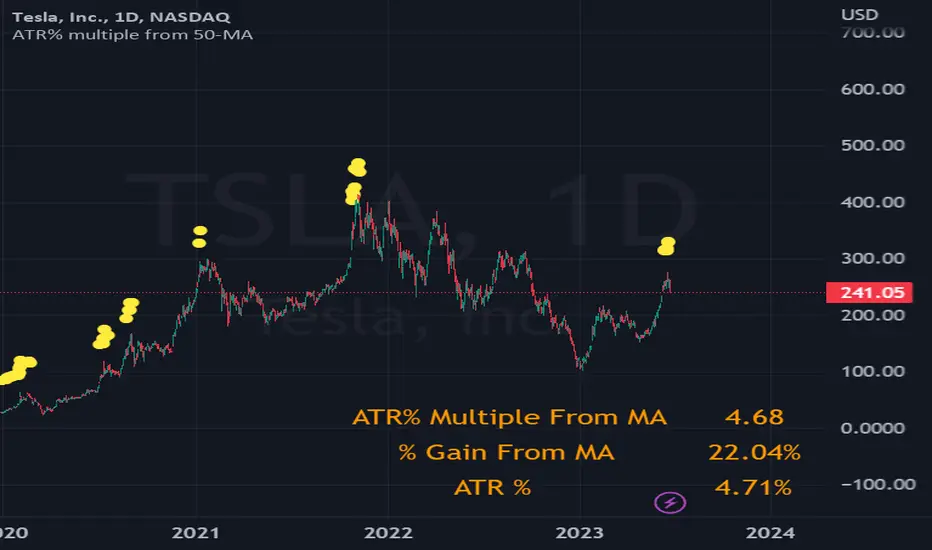
ATR% multiple from 50-MABig credits again to TradingView User @Fred6724 to develop this tool on my behalf to our community.
How can one measure stock price extension?
In my view, decision-making in the trading business should rely on quantifiable data. A method I personally employ for scaling out and taking partial profits involves setting a threshold based on the multiple of Average True Range (ATR%) from the 50-day Simple Moving Average (SMA). For instance, I find it beneficial to start taking profits when positions exceed 7-10 times the ATR% from the 50-SMA. This practice helps prevent second-guessing or becoming emotionally attached to any particular position.
A relevant example illustrating this concept is the case of PLTR, SOFI, TSLA, VRT, NVDA which experienced a stall and subsequent decline after exceeding 10 times the ATR% from its 50-day moving average.
While there is no foolproof profit-taking mechanism that guarantees selling at the absolute market peak, employing this strategy can be a valuable tool for scaling out profits during extended periods to minimize potential losses.
The formula employed is as below:
A = ATR% = $ ATR / $ Last Done Price
B = % Gain From 50-MA
B / A = ATR% multiple from 50-MA
在脚本中搜索"take profit"
[DisDev] D-I-Y Gridbot🟩 This script is a “do-it-yourself” Grid Bot Simulator, used for visualizing support and resistance levels. Prices are divided into grids, or trade zones, that will trigger signals each time a new zone is entered. During ranging markets, each transaction is followed by a “take profit.” As the market starts to trend, transactions are stacked (compare to DCA ), until the market consolidates. No signals are triggered above the upper gridline or below the lower gridline. Unlike the previous version, all grids may be adjusted in real-time by dragging the gridlines up and down to the desired support and resistance levels.
When adding the indicator to a new chart, you must choose six grid levels by clicking on the desired support or resistance price. You can change all of these levels at any time directly on the chart.
⚡ OVERVIEW ⚡
The D-I-Y Gridbot is an interactive tool designed for visualizing support and resistance levels. As a continuation of the original Gridbot Simulator , which has received significant recognition on TradingView, earning over 4000 boosts and an Editor's Pick status. This tool serves not only as an evolved version of its predecessor, but also as an open-source template for developing future gridbots. It aims to foster discussions and facilitate innovations around grid-trading strategies.
One of the new features of this gridbot is the real-time adjustability of all gridlines. Users can move these lines up and down to set their desired support and resistance levels in response to changing market conditions. Additionally, the D-I-Y Gridbot is compatible with multiple timeframes and can be used on most TradingView charts.
Drag gridlines up or down to desired price level.
Key Features 🔑
All gridlines are adjustable in real-time, directly on the chart
Signals can be filtered by a customizable moving average or by VWAP
Customizable support and resistance levels
Potentially increases profitability in ranging markets
Benefits 💸
Customizable Support and Resistance Levels : The D-I-Y Gridbot allows users to set their preferred support and resistance levels, which can be changed at any time directly on the chart. This provides users with the ability to customize their trading parameters based on their strategy and risk tolerance.
Various Trading Strategies : The D-I-Y Gridbot supports various trading strategies, including Mean Reversion, Ranging Markets, and Dollar-cost averaging (DCA). This allows users to capitalize on price reversals, execute buy and sell orders at predetermined levels, and buy more of an asset as the price falls, respectively.
Multi-Timeframe and Versatility : The D-I-Y Gridbot is compatible with multiple timeframes and can be used on any TradingView chart.
Experimental and Educational : The D-I-Y Gridbot is considered a proof-of-concept tool that is both experimental and educational. This can provide traders with a deeper understanding of grid trading strategies and the ability to experiment with different trading parameters and strategies.
⚙️ CONFIGURATION & SETTINGS ⚙️
Inputs 🔧
Trigger : Candle location to trigger the signal. "Wick" will use either high or low, depending on the signal direction. "Close" will use the close price. “MA” will use the selected moving average or VWAP.
Confirmation : Market direction to confirm the candle trigger. "Reverse" will confirm the signal when the price crosses back over the trigger. "Breakout" will confirm when the price breaks out of the trigger.
Number of Support/Resistance zones : 1 = Only Top Grid is Support/Only Bottom Grid is Resistance. 2 = Top two grids are Resistance/Bottom two grids are Support. 3 = Top three grids are Resistance/Bottom three grids are Support
MA Type : Exponential Moving Average (EMA), Hull Moving Average (HMA), Simple Moving Average (SMA), Triple Exponential Moving Average (TEMA), Volume Weighted Moving Average (VWMA), Volume Weighted Average Price (VWAP)
MA Filter : Use Moving Average as a reversion filter for signals. When enabled, no buys when above MA, no sells when below. Use in conjunction with S/R zones to reduce false signals.
Allow Repeat Signals . When enabled, signals will reset when nearest gridline is triggered. When disabled, only one signal will be triggered per gridline.
Line/Fill colors
Gridlines . Adjusts gridline prices manually.
Left : Trigger = Wick. Confirm = Breakout. Buys are signaled when LOW breaks below gridline. Sells are triggered when HIGH breaks above gridline.
Right : Trigger = Close. Confirm = Breakout. Buys are signaled when the candle CLOSES below the gridline. Sells are triggered when the candle CLOSES above the gridline.
Left : Confirm=Breakout. Signals on breaking through the next gridline.
Right : Confirm=Reverse. Signals only when crossing back from the gridline.
S/R Zones=1. Upper gridline is Resistance / Lower is Support. Middle 4 are neutral.
S/R Zones = 3. Upper three gridlines are Resistance / Lower three are Support
Notes:
If gridlines are dragged out of order on a live chart, they will auto-sort into the correct order.
Price levels may be entered in settings, or adjusted in real-time directly on the chart.
When changing symbols, remember to adjust the gridlines to accommodate the new symbol.
Alerts 🔔
Users can set alerts based on their chosen parameters for triggers, confirmations, number of support/resistance zones, and smoothing type, enabling precise control over alert conditions.
💡 USAGE & STRATEGY 💡
Trading Strategies 📈
Mean Reversion: The script can be used to capitalize on price reversals back to the mean.
Ranging Markets: The script excels in ranging markets, executing buy and sell orders at predetermined levels.
Dollar-cost averaging (DCA): The script can be used to execute DCA orders, buying more of an asset as the price falls, and lowering the average cost per unit.
Timeframes and Symbols ⌚
Multi-Timeframe: The indicator is compatible with multiple timeframes.
Versatile: Can be used on any crypto trading pair on TradingView.
🤖 DETAILS & METHODOLOGY 🤖
Algorithm and Calculation 🛡️
Grids are set and adjusted when loading the indicator on the chart and may be customized anytime afterward by clicking and dragging the gridlines on the chart.
Gridlines are updated, sorted, and stored in a float array.
Signals are calculated based on candle trigger, market direction, and previous price level.
📚 ADDITIONAL RESOURCES 📚
Chart Examples 📊
S/R Zones = 3: Three Support and Three Resistance. Filter = 50-period Triple Exponential Moving Average (TEMA)
S/R Zones = 1: One Support, One Resistance, and Four Neutral Zones. Support Zones: Buys only. Resistance Zones: Sells only. Neutral Zones: Grid-dependent
When MA filter is enabled, Buys are only triggered below Moving Average, and Sells are only triggered above.
Trigger = Wick. Confirmation = Breakout. Buys are signaled when Low breaks above the next grid level. Sells are signaled when High breaks below the next grid level.
🚀 CONCLUSION 🚀
The D-I-Y Gridbot is a proof-of-concept, emphasizing its experimental and educational nature. In future versions, we will aim to incorporate concepts such as auto-adjusting grids and angled grids for trending markets. The script is designed to evolve through user feedback and suggestions, shaping its future iterations.
Credit: This is a continuation of the Gridbot series by xxattaxx-DisDev . Explicit permission was granted by user xxattaxx-disdev to re-use all Gridbot code and all materials without restrictions.
⚠️ DISCLAIMER ⚠️
This indicator is a proof-of-concept and is considered experimental and educational. When gridlines are drawn in hindsight, signals appear to be predictive and valid. Future results may always vary when the trend direction changes. Comments and suggestions are encouraged.
This indicator is provided as a tool for traders and should not be used as the sole basis for making trading decisions. Always conduct your own research and consider your risk tolerance before entering any trades.

Buy/Sell Toolkit (Expo)█ Overview
The Buy/Sell Toolkit is a comprehensive trading tool designed to provide a holistic approach to trading. It brings together essential trading indicators and features in one place, simplifying the trading process and offering valuable insights into the market.
The indicator serves as an all-inclusive solution for traders seeking in-depth technical insights. While the Buy/Sell Toolkit can be utilized alongside other technical analysis methods, it can also be used as a standalone toolkit, adaptable to any trading style. In addition, each feature is thoughtfully integrated because not all technical indicators are suitable for every market condition or trading style.
The Buy/Sell toolkit works in any market and timeframe for discretionary analysis and includes many features:
█ Features
Buy/Sell signals: This feature provides real-time Buy/Sell trading signals for any market and timeframe. These signals are based on the trend.
Contrarian Signals: This feature provides real-time contrarian signals to take a position against the prevailing market trend.
Ultimate Trend: This feature assists in identifying the overall trend of the market, recognizing whether the market is in an uptrend, downtrend, or sideways.
Trend Advisor: The Trend Advisor helps traders understand the trend's strength, duration, and direction.
Trend Reversal: This feature identifies potential points where the current market may reverse within a trend. It's basically a trend-following line based on reversal calculation; it helps traders catch trend continuation setups.
Momentum Average: This indicator measures the rate of change in prices to identify the strength of the current trend. It can be beneficial for spotting potential price breakouts or warning of a market slowdown and pullbacks.
Take Profit Points: This feature suggests optimal points to exit a trade and lock in profits. It determines these points by using various factors such as volatility, support and resistance levels, and historical price movements.
Candle Coloring, Arithmetic Candlesticks, including Arithmetic Heikin Ashi: This feature provides an excellent visual aid to assist traders in recognizing patterns, identifying trends, and optimizing their trading strategies. The Arithmetic Candlesticks help smooth out price volatility and identify market trends more clearly.
Reversal Cloud: This innovative feature provides a graphical representation of potential price reversal zones. The cloud helps traders visualize where the price might reverse its trend.
Trend Cloud: Similar to the Reversal Cloud, this feature visualizes the prevailing market trend, making it easy for traders to understand the direction of the market at a glance.
Signal Optimizer: The Signal Optimizer is a powerful tool that optimizes the Buy/Sell and contrarian signals based on win-rate or performance. It automatically applies the best settings to the signals, freeing traders from the task of constantly adjusting them. This helps traders to get the most reliable signals automatically, enhancing their trading efficiency.
█ How to use the Buy/Sell Toolkit?
Here are a few illustrative examples to provide traders with a better understanding of the Toolkit's practical usage. These examples showcase the combination of features, but it's important to note that they serve as demonstrations, and we encourage traders to explore and adapt the features to align with their unique trading styles.
Buy/Sell Signals & Take Profit
Optimized Buy/Sell signals & Candle Color + Trend Advisor + Reversal Cloud
Contrarian Signals & Take Profit
,with Reversal Cloud
Optimized Contrarian Signals & Ultimate Trend & Reversal Cloud
Trend Cloud
Filter signals with Trend Cloud
█ Why is this Buy/Sell Toolkit Needed?
The Buy/Sell Toolkit is an exceptional tool for traders because it consolidates several critical trading indicators into a single, user-friendly platform. The Toolkit's holistic approach to market analysis can enhance decision-making, reduce guesswork, and improve overall trading performance. Additionally, it allows traders to customize their approach according to the market conditions and their trading style.
The Toolkit's automated features, such as the Signal Optimizer, save time and effort, making it easier for both new and experienced traders. In addition, its comprehensive suite of features ensures traders have all the information they need to make informed trading decisions. All these features make the Buy/Sell Toolkit a powerful ally in any trader's arsenal.
Here's why this Toolkit is essential:
Comprehensive Market Analysis: The Toolkit offers a wide range of indicators and tools for comprehensive market analysis, from trend detection to momentum analysis. This reduces the need for multiple tools and allows for a more efficient trading process. By providing a host of indicators like Buy/Sell signals, Contrarian Signals, Trend Analysis, and Momentum Average, the Toolkit helps traders make well-informed decisions based on comprehensive data and trend analysis.
Automation and Time-Saving: The Signal Optimizer automatically applies the best settings to the signals based on win rate or performance. This saves time and ensures the signals' reliability, reducing, it makes the trading process efficient and hassle-free.
Versatility: The Toolkit is versatile and can be used for various financial markets, including stocks, forex, commodities, or cryptocurrencies. Regardless of the market you trade in, the Buy/Sell Toolkit has something to offer.
Visual Tools: The Toolkit provides visual tools like Reversal Cloud, Trend Cloud, Trend lines, Candle coloring, and much more, which are excellent for visualizing market trends and potential reversal zones. This can make the process of understanding market movements more intuitive and less intimidating, especially for novice traders.
Confirmation: By using multiple indicators in conjunction with each other, traders can confirm signals and improve the accuracy of their trades.
Learning and Development: The Toolkit serves as an excellent resource for both novice and experienced traders to learn about different trading indicators, how they interact, and how to use them effectively.
█ Any Alert Function Call
This function allows traders to combine any feature and create customized alerts. These alerts can be set for various conditions and customized according to the trader's strategy or preferences.
█ How are the features calculated? - Overview
The Toolkit combines many of our existing premium indicators and new technical analysis algorithms to analyze the market. This overview covers how the main features are calculated.
Buy/Sell
The core function calculates the Exponential Weighting for a given time series X over a period T. The time series is based on absolute price changes. It focuses on the magnitude of price changes from one period to the next, irrespective of the direction (up or down). This type of time series can be used to measure the volatility of a price series, as it quantifies the size of price movements. It's useful in scenarios where the direction of the change is not as important as the magnitude of the change.
Contrarian Signals
Our contrarian signals are based on deviation from the expected range value. The algorithm quantifies the amount of variation or dispersion in a set of trading ranges. Non-expected values are the fundamental core of the signal generation process.
Ultimate Trend
The Ultimate trend calculates an adaptive smoothing momentum function by first determining the directional price movement and then applying smoothing to the positive and negative price changes. It then uses these values to calculate a form of Variable Moving Average (VMA), where the smoothing factor is adjusted based on a normalized measure of the relative difference between the Positive and Negative Directional values.
Trend Advisor
It's a form of Moving Averages that are applied to the price chart using three different weighting functions, simple weighting, price volatility smoothing constant weighting, and the traditional EMA weighting function.
Trend Reversal and Cloud
The function uses the information on how much the current price compared to the relative historical price fluctuates over a specific period and automatically updates its equilibrium value at new price changes.
Momentum Average
Essentially, it uses a modified version of the relative rate of change over a certain period.
Take Profit
The take profit uses similar range price functions as the contrarian signals, where a take profit signal is triggered at extremely abnormal values.
Candles
Note, Using and Backtesting on non-standard charts produces unrealistic results since it does not represent the closing price. The candles are based on a smoothing process that finds the best smoothing coefficient for the current data, using close as time series.
█ In conclusion , The Buy/Sell Toolkit serves as a comprehensive, user-friendly, and efficient trading assistant. It brings automation and intelligent data play-by-play to your fingertips, making it an essential tool for anyone serious about trading.
-----------------
Disclaimer
The information contained in my Scripts/Indicators/Ideas/Algos/Systems does not constitute financial advice or a solicitation to buy or sell any securities of any type. I will not accept liability for any loss or damage, including without limitation any loss of profit, which may arise directly or indirectly from the use of or reliance on such information.
All investments involve risk, and the past performance of a security, industry, sector, market, financial product, trading strategy, backtest, or individual's trading does not guarantee future results or returns. Investors are fully responsible for any investment decisions they make. Such decisions should be based solely on an evaluation of their financial circumstances, investment objectives, risk tolerance, and liquidity needs.
My Scripts/Indicators/Ideas/Algos/Systems are only for educational purposes!
付费脚本

Vaidotas Momentum ScoreHello Traders!
Discover Myfractalrange latest addition on TradingView, Vaidotas Segenis Momentum Score.
How people calculate Momentum is subjective and many people (even professionals) use different Momentum formulas depending on how they view it. This is sometimes confusing for traders.
The purpose of this indicator is to identify periods of strong price momentum relative to historical volatility. Higher momentum scores indicate stronger price trends, while lower scores suggest weaker trends. Traders and investors may use this indicator to identify potential buy or sell signals based on the strength of price movements. The formula Vaidotas uses calculate Momentum Score for different periods based on the price data.
There are 3 different look back periods in the script, you will find them in "Input":
Period 1 : 10 Days
Period 2 : 30 Days
Period 3 : 90 Days
Now let's go over the different steps of the formula:
Step 1 - Calculate the daily normal returns : this gives the daily percentage change in price
Step 2 - Calculate the standard deviation of the daily normal returns over a specific look back period (Default: 100 days) : the standard deviation measures the volatility or dispersion of the returns
Step 4 - Calculate the squared standard deviation multiplied by the square root of the respective period: This is done for three different periods (Period 1, Period 2, Period 3), it amplifies the standard deviation by the square root of the period, which gives more weight to recent price changes.
Step 5 - Calculate the normal returns for each period: This calculates the percentage change in price over the specified period
Step 5 - Calculate the momentum score for each period: This score represents the relative strength or momentum of the price change compared to the expected volatility.
Using the momentum indicator involves interpreting the values and considering certain thresholds to make trading decisions. While there is no definitive rule for all markets and assets, we can provide you with a general guideline on how traders may want to use the indicator and explain the significance of certain values:
1) Strong Trend: When the momentum score is significantly positive (above a certain threshold, such as +2), it suggests a strong upward price trend.
2) Weak Trend: Conversely, when the momentum score is significantly negative (below a certain threshold, such as -2), it indicates a strong downward price trend. Traders may interpret this as a potential signal to enter or maintain a short position, expecting the trend to continue.
3) Lack of Trend: When the momentum score is close to zero, it suggests a lack of significant trend or sideways movement in the price. Values around 0 indicate a potential range-bound market or consolidation.
However, it's important to note that the specific threshold values for defining significant trends or reversals may vary depending on the asset, timeframe, and market conditions. Traders often adjust these thresholds based on their own experience and backtesting results.
Here are a few more examples to illustrate the use of the momentum indicator:
- Example 1 - Strong Uptrend Confirmation :
The momentum score is consistently above +2, indicating a strong upward trend. Traders may consider this as a potential signal to enter or maintain a long position, expecting the trend to continue.
- Example 2 - Reversal Signal :
The momentum score has been positive for an extended period but starts to decline and eventually crosses below -2. This could be seen as a potential reversal signal, suggesting that the uptrend is losing strength and a bearish trend might develop. Traders may consider exiting long positions or even taking short positions based on this reversal signal.
- Example 3 - Sideways Market :
The momentum score fluctuates around 0, without displaying any significant positive or negative values. This indicates a lack of clear trend and suggests that the asset is trading in a range or consolidating. Traders may choose to avoid taking new positions until a stronger trend emerges.
Why is it interesting to use different look back periods?
The use of different look back periods in the momentum indicator formula allows traders to assess momentum across multiple timeframes. By comparing the momentum results for each period, traders can gain a broader perspective on the strength of the trend and potential opportunities. Here's how a trader might use the different look back periods and their corresponding momentum results:
1) Identifying Consistency: Traders can compare the momentum results for different periods to assess the consistency of the trend. If the momentum scores for all periods are consistently positive or negative, it suggests a strong and consistent trend across multiple timeframes. This can provide traders with higher confidence in the trend's strength and potential trading opportunities.
2) Convergence or Divergence: Traders can analyze the relationship between the momentum results for different periods. If the momentum scores for all periods are converging (moving closer together), it indicates a higher degree of agreement across different timeframes and strengthens the signal. Conversely, if the momentum scores for different periods diverge (move apart), it may suggest a weakening or conflicting trend. Traders should exercise caution when the momentum scores diverge as it may signal a potential reversal or market uncertainty.
3) Confirmation of Momentum: Traders can use the momentum results for different periods to confirm the strength of a trend. For example, if the momentum scores for shorter periods (e.g., Period 1) are significantly higher than those for longer periods (e.g., Period 2 and Period 3), it suggests a recent increase in momentum and a potentially stronger trend. This confirmation can assist traders in making more informed trading decisions and timing their entries or exits.
4) Multiple Timeframe Analysis: Traders often employ a multiple timeframe analysis approach to validate their trading decisions. By comparing the momentum results for different periods, traders can assess the alignment of momentum across various timeframes. For instance, if the momentum scores for shorter, medium, and longer periods all indicate a strong trend in the same direction, it reinforces the conviction in the trade.
As a conclusion, the momentum indicator can be useful to traders for several reasons:
1) Identifying Trend Strength: The momentum indicator helps traders assess the strength of a price trend. When the momentum score is high, it suggests that the trend is strong and likely to continue. This information can be valuable for trend-following strategies, as it helps traders identify potentially profitable opportunities and stay on the right side of the market.
2) Spotting Reversals: Momentum indicators can also help traders identify potential trend reversals. When the momentum score diverges from the price movement, it may indicate a weakening trend or an upcoming reversal. Traders can use this signal to adjust their positions or look for opportunities to enter or exit trades.
3) Confirming Breakouts: Breakout traders often use momentum indicators to confirm the validity of a breakout. If a price breaks above a resistance level, and the momentum score also increases significantly, it provides additional confirmation that the breakout is strong and may continue. This helps traders have more confidence in their breakout trades.
4) Setting Stop Loss and Take Profit Levels: By understanding the strength of a price trend through the momentum indicator, traders can set appropriate stop-loss and take-profit levels. A strong momentum score may indicate that a trend is likely to continue, allowing traders to set wider profit targets. Conversely, a weak momentum score may suggest that the trend is losing steam, prompting traders to set tighter stop-loss levels to protect their capital.
4) Divergence Analysis: Momentum indicators can be used in conjunction with other technical indicators to identify divergences. Divergence occurs when the price and momentum indicator move in opposite directions. It can signal potential trend reversals or shifts in market sentiment, providing traders with opportunities to adjust their positions.
It's important to note that while momentum indicators can be useful tools, they should not be relied upon solely for making trading decisions. It's recommended to use them in conjunction with other technical analysis tools and consider other factors such as market conditions, risk management, and fundamental analysis. Remember that the momentum indicator is just one tool among many, and it's important to consider other factors such as volume, trend, volatility, and overall market conditions when making trading decisions. Additionally, using stop-loss orders and proper risk management techniques is crucial to mitigate potential losses.
We hope that you will find these explanations useful, please contact us by private message for access.
Enjoy!
DISCLAIMER: No sharing, copying, reselling, modifying, or any other forms of use are authorised. This script is strictly for individual use and educational purposes only. This is not financial or investment advice. Investments are always made at your own risk and are based on your personal judgement. Myfractalrange is not responsible for any losses you may incur. Please invest wisely.
Inside candle (Inside Bar) Strategy- by smartanuThe Inside Candle strategy is a popular price action trading strategy that can be used to trade in a variety of markets. Here's how you can trade the Inside Candle strategy using the Pine script code provided:
1. Identify an Inside Candle: Look for a candlestick pattern where the current candle is completely engulfed within the previous candle's high and low. This is known as an Inside Candle.
2. Enter a Long Position: If an Inside Candle is identified, enter a long position at the open of the next candle using the Pine script code provided.
3. Set Stop Loss and Take Profit: Set a stop loss at a reasonable level to limit your potential losses if the trade goes against you. Set a take profit at a reasonable level to take profit when the price reaches the desired level.
4. Manage the Trade: Monitor the trade closely and adjust the stop loss and take profit levels if necessary. You can use the Pine script code to automatically exit the trade when the stop loss or take profit level is hit.
5. Exit the Trade: Exit the trade when the price reaches the take profit level or the stop loss level is hit.
It's important to note that the Inside Candle strategy is just one of many strategies that traders use to trade the markets. It's important to perform your own analysis and use additional indicators before making any trades. Additionally, it's important to practice proper risk management techniques and never risk more than you can afford to lose.

Goertzel Cycle Composite Wave [Loxx]As the financial markets become increasingly complex and data-driven, traders and analysts must leverage powerful tools to gain insights and make informed decisions. One such tool is the Goertzel Cycle Composite Wave indicator, a sophisticated technical analysis indicator that helps identify cyclical patterns in financial data. This powerful tool is capable of detecting cyclical patterns in financial data, helping traders to make better predictions and optimize their trading strategies. With its unique combination of mathematical algorithms and advanced charting capabilities, this indicator has the potential to revolutionize the way we approach financial modeling and trading.
*** To decrease the load time of this indicator, only XX many bars back will render to the chart. You can control this value with the setting "Number of Bars to Render". This doesn't have anything to do with repainting or the indicator being endpointed***
█ Brief Overview of the Goertzel Cycle Composite Wave
The Goertzel Cycle Composite Wave is a sophisticated technical analysis tool that utilizes the Goertzel algorithm to analyze and visualize cyclical components within a financial time series. By identifying these cycles and their characteristics, the indicator aims to provide valuable insights into the market's underlying price movements, which could potentially be used for making informed trading decisions.
The Goertzel Cycle Composite Wave is considered a non-repainting and endpointed indicator. This means that once a value has been calculated for a specific bar, that value will not change in subsequent bars, and the indicator is designed to have a clear start and end point. This is an important characteristic for indicators used in technical analysis, as it allows traders to make informed decisions based on historical data without the risk of hindsight bias or future changes in the indicator's values. This means traders can use this indicator trading purposes.
The repainting version of this indicator with forecasting, cycle selection/elimination options, and data output table can be found here:
Goertzel Browser
The primary purpose of this indicator is to:
1. Detect and analyze the dominant cycles present in the price data.
2. Reconstruct and visualize the composite wave based on the detected cycles.
To achieve this, the indicator performs several tasks:
1. Detrending the price data: The indicator preprocesses the price data using various detrending techniques, such as Hodrick-Prescott filters, zero-lag moving averages, and linear regression, to remove the underlying trend and focus on the cyclical components.
2. Applying the Goertzel algorithm: The indicator applies the Goertzel algorithm to the detrended price data, identifying the dominant cycles and their characteristics, such as amplitude, phase, and cycle strength.
3. Constructing the composite wave: The indicator reconstructs the composite wave by combining the detected cycles, either by using a user-defined list of cycles or by selecting the top N cycles based on their amplitude or cycle strength.
4. Visualizing the composite wave: The indicator plots the composite wave, using solid lines for the cycles. The color of the lines indicates whether the wave is increasing or decreasing.
This indicator is a powerful tool that employs the Goertzel algorithm to analyze and visualize the cyclical components within a financial time series. By providing insights into the underlying price movements, the indicator aims to assist traders in making more informed decisions.
█ What is the Goertzel Algorithm?
The Goertzel algorithm, named after Gerald Goertzel, is a digital signal processing technique that is used to efficiently compute individual terms of the Discrete Fourier Transform (DFT). It was first introduced in 1958, and since then, it has found various applications in the fields of engineering, mathematics, and physics.
The Goertzel algorithm is primarily used to detect specific frequency components within a digital signal, making it particularly useful in applications where only a few frequency components are of interest. The algorithm is computationally efficient, as it requires fewer calculations than the Fast Fourier Transform (FFT) when detecting a small number of frequency components. This efficiency makes the Goertzel algorithm a popular choice in applications such as:
1. Telecommunications: The Goertzel algorithm is used for decoding Dual-Tone Multi-Frequency (DTMF) signals, which are the tones generated when pressing buttons on a telephone keypad. By identifying specific frequency components, the algorithm can accurately determine which button has been pressed.
2. Audio processing: The algorithm can be used to detect specific pitches or harmonics in an audio signal, making it useful in applications like pitch detection and tuning musical instruments.
3. Vibration analysis: In the field of mechanical engineering, the Goertzel algorithm can be applied to analyze vibrations in rotating machinery, helping to identify faulty components or signs of wear.
4. Power system analysis: The algorithm can be used to measure harmonic content in power systems, allowing engineers to assess power quality and detect potential issues.
The Goertzel algorithm is used in these applications because it offers several advantages over other methods, such as the FFT:
1. Computational efficiency: The Goertzel algorithm requires fewer calculations when detecting a small number of frequency components, making it more computationally efficient than the FFT in these cases.
2. Real-time analysis: The algorithm can be implemented in a streaming fashion, allowing for real-time analysis of signals, which is crucial in applications like telecommunications and audio processing.
3. Memory efficiency: The Goertzel algorithm requires less memory than the FFT, as it only computes the frequency components of interest.
4. Precision: The algorithm is less susceptible to numerical errors compared to the FFT, ensuring more accurate results in applications where precision is essential.
The Goertzel algorithm is an efficient digital signal processing technique that is primarily used to detect specific frequency components within a signal. Its computational efficiency, real-time capabilities, and precision make it an attractive choice for various applications, including telecommunications, audio processing, vibration analysis, and power system analysis. The algorithm has been widely adopted since its introduction in 1958 and continues to be an essential tool in the fields of engineering, mathematics, and physics.
█ Goertzel Algorithm in Quantitative Finance: In-Depth Analysis and Applications
The Goertzel algorithm, initially designed for signal processing in telecommunications, has gained significant traction in the financial industry due to its efficient frequency detection capabilities. In quantitative finance, the Goertzel algorithm has been utilized for uncovering hidden market cycles, developing data-driven trading strategies, and optimizing risk management. This section delves deeper into the applications of the Goertzel algorithm in finance, particularly within the context of quantitative trading and analysis.
Unveiling Hidden Market Cycles:
Market cycles are prevalent in financial markets and arise from various factors, such as economic conditions, investor psychology, and market participant behavior. The Goertzel algorithm's ability to detect and isolate specific frequencies in price data helps trader analysts identify hidden market cycles that may otherwise go unnoticed. By examining the amplitude, phase, and periodicity of each cycle, traders can better understand the underlying market structure and dynamics, enabling them to develop more informed and effective trading strategies.
Developing Quantitative Trading Strategies:
The Goertzel algorithm's versatility allows traders to incorporate its insights into a wide range of trading strategies. By identifying the dominant market cycles in a financial instrument's price data, traders can create data-driven strategies that capitalize on the cyclical nature of markets.
For instance, a trader may develop a mean-reversion strategy that takes advantage of the identified cycles. By establishing positions when the price deviates from the predicted cycle, the trader can profit from the subsequent reversion to the cycle's mean. Similarly, a momentum-based strategy could be designed to exploit the persistence of a dominant cycle by entering positions that align with the cycle's direction.
Enhancing Risk Management:
The Goertzel algorithm plays a vital role in risk management for quantitative strategies. By analyzing the cyclical components of a financial instrument's price data, traders can gain insights into the potential risks associated with their trading strategies.
By monitoring the amplitude and phase of dominant cycles, a trader can detect changes in market dynamics that may pose risks to their positions. For example, a sudden increase in amplitude may indicate heightened volatility, prompting the trader to adjust position sizing or employ hedging techniques to protect their portfolio. Additionally, changes in phase alignment could signal a potential shift in market sentiment, necessitating adjustments to the trading strategy.
Expanding Quantitative Toolkits:
Traders can augment the Goertzel algorithm's insights by combining it with other quantitative techniques, creating a more comprehensive and sophisticated analysis framework. For example, machine learning algorithms, such as neural networks or support vector machines, could be trained on features extracted from the Goertzel algorithm to predict future price movements more accurately.
Furthermore, the Goertzel algorithm can be integrated with other technical analysis tools, such as moving averages or oscillators, to enhance their effectiveness. By applying these tools to the identified cycles, traders can generate more robust and reliable trading signals.
The Goertzel algorithm offers invaluable benefits to quantitative finance practitioners by uncovering hidden market cycles, aiding in the development of data-driven trading strategies, and improving risk management. By leveraging the insights provided by the Goertzel algorithm and integrating it with other quantitative techniques, traders can gain a deeper understanding of market dynamics and devise more effective trading strategies.
█ Indicator Inputs
src: This is the source data for the analysis, typically the closing price of the financial instrument.
detrendornot: This input determines the method used for detrending the source data. Detrending is the process of removing the underlying trend from the data to focus on the cyclical components.
The available options are:
hpsmthdt: Detrend using Hodrick-Prescott filter centered moving average.
zlagsmthdt: Detrend using zero-lag moving average centered moving average.
logZlagRegression: Detrend using logarithmic zero-lag linear regression.
hpsmth: Detrend using Hodrick-Prescott filter.
zlagsmth: Detrend using zero-lag moving average.
DT_HPper1 and DT_HPper2: These inputs define the period range for the Hodrick-Prescott filter centered moving average when detrendornot is set to hpsmthdt.
DT_ZLper1 and DT_ZLper2: These inputs define the period range for the zero-lag moving average centered moving average when detrendornot is set to zlagsmthdt.
DT_RegZLsmoothPer: This input defines the period for the zero-lag moving average used in logarithmic zero-lag linear regression when detrendornot is set to logZlagRegression.
HPsmoothPer: This input defines the period for the Hodrick-Prescott filter when detrendornot is set to hpsmth.
ZLMAsmoothPer: This input defines the period for the zero-lag moving average when detrendornot is set to zlagsmth.
MaxPer: This input sets the maximum period for the Goertzel algorithm to search for cycles.
squaredAmp: This boolean input determines whether the amplitude should be squared in the Goertzel algorithm.
useAddition: This boolean input determines whether the Goertzel algorithm should use addition for combining the cycles.
useCosine: This boolean input determines whether the Goertzel algorithm should use cosine waves instead of sine waves.
UseCycleStrength: This boolean input determines whether the Goertzel algorithm should compute the cycle strength, which is a normalized measure of the cycle's amplitude.
WindowSizePast: These inputs define the window size for the composite wave.
FilterBartels: This boolean input determines whether Bartel's test should be applied to filter out non-significant cycles.
BartNoCycles: This input sets the number of cycles to be used in Bartel's test.
BartSmoothPer: This input sets the period for the moving average used in Bartel's test.
BartSigLimit: This input sets the significance limit for Bartel's test, below which cycles are considered insignificant.
SortBartels: This boolean input determines whether the cycles should be sorted by their Bartel's test results.
StartAtCycle: This input determines the starting index for selecting the top N cycles when UseCycleList is set to false. This allows you to skip a certain number of cycles from the top before selecting the desired number of cycles.
UseTopCycles: This input sets the number of top cycles to use for constructing the composite wave when UseCycleList is set to false. The cycles are ranked based on their amplitudes or cycle strengths, depending on the UseCycleStrength input.
SubtractNoise: This boolean input determines whether to subtract the noise (remaining cycles) from the composite wave. If set to true, the composite wave will only include the top N cycles specified by UseTopCycles.
█ Exploring Auxiliary Functions
The following functions demonstrate advanced techniques for analyzing financial markets, including zero-lag moving averages, Bartels probability, detrending, and Hodrick-Prescott filtering. This section examines each function in detail, explaining their purpose, methodology, and applications in finance. We will examine how each function contributes to the overall performance and effectiveness of the indicator and how they work together to create a powerful analytical tool.
Zero-Lag Moving Average:
The zero-lag moving average function is designed to minimize the lag typically associated with moving averages. This is achieved through a two-step weighted linear regression process that emphasizes more recent data points. The function calculates a linearly weighted moving average (LWMA) on the input data and then applies another LWMA on the result. By doing this, the function creates a moving average that closely follows the price action, reducing the lag and improving the responsiveness of the indicator.
The zero-lag moving average function is used in the indicator to provide a responsive, low-lag smoothing of the input data. This function helps reduce the noise and fluctuations in the data, making it easier to identify and analyze underlying trends and patterns. By minimizing the lag associated with traditional moving averages, this function allows the indicator to react more quickly to changes in market conditions, providing timely signals and improving the overall effectiveness of the indicator.
Bartels Probability:
The Bartels probability function calculates the probability of a given cycle being significant in a time series. It uses a mathematical test called the Bartels test to assess the significance of cycles detected in the data. The function calculates coefficients for each detected cycle and computes an average amplitude and an expected amplitude. By comparing these values, the Bartels probability is derived, indicating the likelihood of a cycle's significance. This information can help in identifying and analyzing dominant cycles in financial markets.
The Bartels probability function is incorporated into the indicator to assess the significance of detected cycles in the input data. By calculating the Bartels probability for each cycle, the indicator can prioritize the most significant cycles and focus on the market dynamics that are most relevant to the current trading environment. This function enhances the indicator's ability to identify dominant market cycles, improving its predictive power and aiding in the development of effective trading strategies.
Detrend Logarithmic Zero-Lag Regression:
The detrend logarithmic zero-lag regression function is used for detrending data while minimizing lag. It combines a zero-lag moving average with a linear regression detrending method. The function first calculates the zero-lag moving average of the logarithm of input data and then applies a linear regression to remove the trend. By detrending the data, the function isolates the cyclical components, making it easier to analyze and interpret the underlying market dynamics.
The detrend logarithmic zero-lag regression function is used in the indicator to isolate the cyclical components of the input data. By detrending the data, the function enables the indicator to focus on the cyclical movements in the market, making it easier to analyze and interpret market dynamics. This function is essential for identifying cyclical patterns and understanding the interactions between different market cycles, which can inform trading decisions and enhance overall market understanding.
Bartels Cycle Significance Test:
The Bartels cycle significance test is a function that combines the Bartels probability function and the detrend logarithmic zero-lag regression function to assess the significance of detected cycles. The function calculates the Bartels probability for each cycle and stores the results in an array. By analyzing the probability values, traders and analysts can identify the most significant cycles in the data, which can be used to develop trading strategies and improve market understanding.
The Bartels cycle significance test function is integrated into the indicator to provide a comprehensive analysis of the significance of detected cycles. By combining the Bartels probability function and the detrend logarithmic zero-lag regression function, this test evaluates the significance of each cycle and stores the results in an array. The indicator can then use this information to prioritize the most significant cycles and focus on the most relevant market dynamics. This function enhances the indicator's ability to identify and analyze dominant market cycles, providing valuable insights for trading and market analysis.
Hodrick-Prescott Filter:
The Hodrick-Prescott filter is a popular technique used to separate the trend and cyclical components of a time series. The function applies a smoothing parameter to the input data and calculates a smoothed series using a two-sided filter. This smoothed series represents the trend component, which can be subtracted from the original data to obtain the cyclical component. The Hodrick-Prescott filter is commonly used in economics and finance to analyze economic data and financial market trends.
The Hodrick-Prescott filter is incorporated into the indicator to separate the trend and cyclical components of the input data. By applying the filter to the data, the indicator can isolate the trend component, which can be used to analyze long-term market trends and inform trading decisions. Additionally, the cyclical component can be used to identify shorter-term market dynamics and provide insights into potential trading opportunities. The inclusion of the Hodrick-Prescott filter adds another layer of analysis to the indicator, making it more versatile and comprehensive.
Detrending Options: Detrend Centered Moving Average:
The detrend centered moving average function provides different detrending methods, including the Hodrick-Prescott filter and the zero-lag moving average, based on the selected detrending method. The function calculates two sets of smoothed values using the chosen method and subtracts one set from the other to obtain a detrended series. By offering multiple detrending options, this function allows traders and analysts to select the most appropriate method for their specific needs and preferences.
The detrend centered moving average function is integrated into the indicator to provide users with multiple detrending options, including the Hodrick-Prescott filter and the zero-lag moving average. By offering multiple detrending methods, the indicator allows users to customize the analysis to their specific needs and preferences, enhancing the indicator's overall utility and adaptability. This function ensures that the indicator can cater to a wide range of trading styles and objectives, making it a valuable tool for a diverse group of market participants.
The auxiliary functions functions discussed in this section demonstrate the power and versatility of mathematical techniques in analyzing financial markets. By understanding and implementing these functions, traders and analysts can gain valuable insights into market dynamics, improve their trading strategies, and make more informed decisions. The combination of zero-lag moving averages, Bartels probability, detrending methods, and the Hodrick-Prescott filter provides a comprehensive toolkit for analyzing and interpreting financial data. The integration of advanced functions in a financial indicator creates a powerful and versatile analytical tool that can provide valuable insights into financial markets. By combining the zero-lag moving average,
█ In-Depth Analysis of the Goertzel Cycle Composite Wave Code
The Goertzel Cycle Composite Wave code is an implementation of the Goertzel Algorithm, an efficient technique to perform spectral analysis on a signal. The code is designed to detect and analyze dominant cycles within a given financial market data set. This section will provide an extremely detailed explanation of the code, its structure, functions, and intended purpose.
Function signature and input parameters:
The Goertzel Cycle Composite Wave function accepts numerous input parameters for customization, including source data (src), the current bar (forBar), sample size (samplesize), period (per), squared amplitude flag (squaredAmp), addition flag (useAddition), cosine flag (useCosine), cycle strength flag (UseCycleStrength), past sizes (WindowSizePast), Bartels filter flag (FilterBartels), Bartels-related parameters (BartNoCycles, BartSmoothPer, BartSigLimit), sorting flag (SortBartels), and output buffers (goeWorkPast, cyclebuffer, amplitudebuffer, phasebuffer, cycleBartelsBuffer).
Initializing variables and arrays:
The code initializes several float arrays (goeWork1, goeWork2, goeWork3, goeWork4) with the same length as twice the period (2 * per). These arrays store intermediate results during the execution of the algorithm.
Preprocessing input data:
The input data (src) undergoes preprocessing to remove linear trends. This step enhances the algorithm's ability to focus on cyclical components in the data. The linear trend is calculated by finding the slope between the first and last values of the input data within the sample.
Iterative calculation of Goertzel coefficients:
The core of the Goertzel Cycle Composite Wave algorithm lies in the iterative calculation of Goertzel coefficients for each frequency bin. These coefficients represent the spectral content of the input data at different frequencies. The code iterates through the range of frequencies, calculating the Goertzel coefficients using a nested loop structure.
Cycle strength computation:
The code calculates the cycle strength based on the Goertzel coefficients. This is an optional step, controlled by the UseCycleStrength flag. The cycle strength provides information on the relative influence of each cycle on the data per bar, considering both amplitude and cycle length. The algorithm computes the cycle strength either by squaring the amplitude (controlled by squaredAmp flag) or using the actual amplitude values.
Phase calculation:
The Goertzel Cycle Composite Wave code computes the phase of each cycle, which represents the position of the cycle within the input data. The phase is calculated using the arctangent function (math.atan) based on the ratio of the imaginary and real components of the Goertzel coefficients.
Peak detection and cycle extraction:
The algorithm performs peak detection on the computed amplitudes or cycle strengths to identify dominant cycles. It stores the detected cycles in the cyclebuffer array, along with their corresponding amplitudes and phases in the amplitudebuffer and phasebuffer arrays, respectively.
Sorting cycles by amplitude or cycle strength:
The code sorts the detected cycles based on their amplitude or cycle strength in descending order. This allows the algorithm to prioritize cycles with the most significant impact on the input data.
Bartels cycle significance test:
If the FilterBartels flag is set, the code performs a Bartels cycle significance test on the detected cycles. This test determines the statistical significance of each cycle and filters out the insignificant cycles. The significant cycles are stored in the cycleBartelsBuffer array. If the SortBartels flag is set, the code sorts the significant cycles based on their Bartels significance values.
Waveform calculation:
The Goertzel Cycle Composite Wave code calculates the waveform of the significant cycles for specified time windows. The windows are defined by the WindowSizePast parameters, respectively. The algorithm uses either cosine or sine functions (controlled by the useCosine flag) to calculate the waveforms for each cycle. The useAddition flag determines whether the waveforms should be added or subtracted.
Storing waveforms in a matrix:
The calculated waveforms for the cycle is stored in the matrix - goeWorkPast. This matrix holds the waveforms for the specified time windows. Each row in the matrix represents a time window position, and each column corresponds to a cycle.
Returning the number of cycles:
The Goertzel Cycle Composite Wave function returns the total number of detected cycles (number_of_cycles) after processing the input data. This information can be used to further analyze the results or to visualize the detected cycles.
The Goertzel Cycle Composite Wave code is a comprehensive implementation of the Goertzel Algorithm, specifically designed for detecting and analyzing dominant cycles within financial market data. The code offers a high level of customization, allowing users to fine-tune the algorithm based on their specific needs. The Goertzel Cycle Composite Wave's combination of preprocessing, iterative calculations, cycle extraction, sorting, significance testing, and waveform calculation makes it a powerful tool for understanding cyclical components in financial data.
█ Generating and Visualizing Composite Waveform
The indicator calculates and visualizes the composite waveform for specified time windows based on the detected cycles. Here's a detailed explanation of this process:
Updating WindowSizePast:
The WindowSizePast is updated to ensure they are at least twice the MaxPer (maximum period).
Initializing matrices and arrays:
The matrix goeWorkPast is initialized to store the Goertzel results for specified time windows. Multiple arrays are also initialized to store cycle, amplitude, phase, and Bartels information.
Preparing the source data (srcVal) array:
The source data is copied into an array, srcVal, and detrended using one of the selected methods (hpsmthdt, zlagsmthdt, logZlagRegression, hpsmth, or zlagsmth).
Goertzel function call:
The Goertzel function is called to analyze the detrended source data and extract cycle information. The output, number_of_cycles, contains the number of detected cycles.
Initializing arrays for waveforms:
The goertzel array is initialized to store the endpoint Goertzel.
Calculating composite waveform (goertzel array):
The composite waveform is calculated by summing the selected cycles (either from the user-defined cycle list or the top cycles) and optionally subtracting the noise component.
Drawing composite waveform (pvlines):
The composite waveform is drawn on the chart using solid lines. The color of the lines is determined by the direction of the waveform (green for upward, red for downward).
To summarize, this indicator generates a composite waveform based on the detected cycles in the financial data. It calculates the composite waveforms and visualizes them on the chart using colored lines.
█ Enhancing the Goertzel Algorithm-Based Script for Financial Modeling and Trading
The Goertzel algorithm-based script for detecting dominant cycles in financial data is a powerful tool for financial modeling and trading. It provides valuable insights into the past behavior of these cycles. However, as with any algorithm, there is always room for improvement. This section discusses potential enhancements to the existing script to make it even more robust and versatile for financial modeling, general trading, advanced trading, and high-frequency finance trading.
Enhancements for Financial Modeling
Data preprocessing: One way to improve the script's performance for financial modeling is to introduce more advanced data preprocessing techniques. This could include removing outliers, handling missing data, and normalizing the data to ensure consistent and accurate results.
Additional detrending and smoothing methods: Incorporating more sophisticated detrending and smoothing techniques, such as wavelet transform or empirical mode decomposition, can help improve the script's ability to accurately identify cycles and trends in the data.
Machine learning integration: Integrating machine learning techniques, such as artificial neural networks or support vector machines, can help enhance the script's predictive capabilities, leading to more accurate financial models.
Enhancements for General and Advanced Trading
Customizable indicator integration: Allowing users to integrate their own technical indicators can help improve the script's effectiveness for both general and advanced trading. By enabling the combination of the dominant cycle information with other technical analysis tools, traders can develop more comprehensive trading strategies.
Risk management and position sizing: Incorporating risk management and position sizing functionality into the script can help traders better manage their trades and control potential losses. This can be achieved by calculating the optimal position size based on the user's risk tolerance and account size.
Multi-timeframe analysis: Enhancing the script to perform multi-timeframe analysis can provide traders with a more holistic view of market trends and cycles. By identifying dominant cycles on different timeframes, traders can gain insights into the potential confluence of cycles and make better-informed trading decisions.
Enhancements for High-Frequency Finance Trading
Algorithm optimization: To ensure the script's suitability for high-frequency finance trading, optimizing the algorithm for faster execution is crucial. This can be achieved by employing efficient data structures and refining the calculation methods to minimize computational complexity.
Real-time data streaming: Integrating real-time data streaming capabilities into the script can help high-frequency traders react to market changes more quickly. By continuously updating the cycle information based on real-time market data, traders can adapt their strategies accordingly and capitalize on short-term market fluctuations.
Order execution and trade management: To fully leverage the script's capabilities for high-frequency trading, implementing functionality for automated order execution and trade management is essential. This can include features such as stop-loss and take-profit orders, trailing stops, and automated trade exit strategies.
While the existing Goertzel algorithm-based script is a valuable tool for detecting dominant cycles in financial data, there are several potential enhancements that can make it even more powerful for financial modeling, general trading, advanced trading, and high-frequency finance trading. By incorporating these improvements, the script can become a more versatile and effective tool for traders and financial analysts alike.
█ Understanding the Limitations of the Goertzel Algorithm
While the Goertzel algorithm-based script for detecting dominant cycles in financial data provides valuable insights, it is important to be aware of its limitations and drawbacks. Some of the key drawbacks of this indicator are:
Lagging nature:
As with many other technical indicators, the Goertzel algorithm-based script can suffer from lagging effects, meaning that it may not immediately react to real-time market changes. This lag can lead to late entries and exits, potentially resulting in reduced profitability or increased losses.
Parameter sensitivity:
The performance of the script can be sensitive to the chosen parameters, such as the detrending methods, smoothing techniques, and cycle detection settings. Improper parameter selection may lead to inaccurate cycle detection or increased false signals, which can negatively impact trading performance.
Complexity:
The Goertzel algorithm itself is relatively complex, making it difficult for novice traders or those unfamiliar with the concept of cycle analysis to fully understand and effectively utilize the script. This complexity can also make it challenging to optimize the script for specific trading styles or market conditions.
Overfitting risk:
As with any data-driven approach, there is a risk of overfitting when using the Goertzel algorithm-based script. Overfitting occurs when a model becomes too specific to the historical data it was trained on, leading to poor performance on new, unseen data. This can result in misleading signals and reduced trading performance.
Limited applicability:
The Goertzel algorithm-based script may not be suitable for all markets, trading styles, or timeframes. Its effectiveness in detecting cycles may be limited in certain market conditions, such as during periods of extreme volatility or low liquidity.
While the Goertzel algorithm-based script offers valuable insights into dominant cycles in financial data, it is essential to consider its drawbacks and limitations when incorporating it into a trading strategy. Traders should always use the script in conjunction with other technical and fundamental analysis tools, as well as proper risk management, to make well-informed trading decisions.
█ Interpreting Results
The Goertzel Cycle Composite Wave indicator can be interpreted by analyzing the plotted lines. The indicator plots two lines: composite waves. The composite wave represents the composite wave of the price data.
The composite wave line displays a solid line, with green indicating a bullish trend and red indicating a bearish trend.
Interpreting the Goertzel Cycle Composite Wave indicator involves identifying the trend of the composite wave lines and matching them with the corresponding bullish or bearish color.
█ Conclusion
The Goertzel Cycle Composite Wave indicator is a powerful tool for identifying and analyzing cyclical patterns in financial markets. Its ability to detect multiple cycles of varying frequencies and strengths make it a valuable addition to any trader's technical analysis toolkit. However, it is important to keep in mind that the Goertzel Cycle Composite Wave indicator should be used in conjunction with other technical analysis tools and fundamental analysis to achieve the best results. With continued refinement and development, the Goertzel Cycle Composite Wave indicator has the potential to become a highly effective tool for financial modeling, general trading, advanced trading, and high-frequency finance trading. Its accuracy and versatility make it a promising candidate for further research and development.
█ Footnotes
What is the Bartels Test for Cycle Significance?
The Bartels Cycle Significance Test is a statistical method that determines whether the peaks and troughs of a time series are statistically significant. The test is named after its inventor, George Bartels, who developed it in the mid-20th century.
The Bartels test is designed to analyze the cyclical components of a time series, which can help traders and analysts identify trends and cycles in financial markets. The test calculates a Bartels statistic, which measures the degree of non-randomness or autocorrelation in the time series.
The Bartels statistic is calculated by first splitting the time series into two halves and calculating the range of the peaks and troughs in each half. The test then compares these ranges using a t-test, which measures the significance of the difference between the two ranges.
If the Bartels statistic is greater than a critical value, it indicates that the peaks and troughs in the time series are non-random and that there is a significant cyclical component to the data. Conversely, if the Bartels statistic is less than the critical value, it suggests that the peaks and troughs are random and that there is no significant cyclical component.
The Bartels Cycle Significance Test is particularly useful in financial analysis because it can help traders and analysts identify significant cycles in asset prices, which can in turn inform investment decisions. However, it is important to note that the test is not perfect and can produce false signals in certain situations, particularly in noisy or volatile markets. Therefore, it is always recommended to use the test in conjunction with other technical and fundamental indicators to confirm trends and cycles.
Deep-dive into the Hodrick-Prescott Fitler
The Hodrick-Prescott (HP) filter is a statistical tool used in economics and finance to separate a time series into two components: a trend component and a cyclical component. It is a powerful tool for identifying long-term trends in economic and financial data and is widely used by economists, central banks, and financial institutions around the world.
The HP filter was first introduced in the 1990s by economists Robert Hodrick and Edward Prescott. It is a simple, two-parameter filter that separates a time series into a trend component and a cyclical component. The trend component represents the long-term behavior of the data, while the cyclical component captures the shorter-term fluctuations around the trend.
The HP filter works by minimizing the following objective function:
Minimize: (Sum of Squared Deviations) + λ (Sum of Squared Second Differences)
Where:
1. The first term represents the deviation of the data from the trend.
2. The second term represents the smoothness of the trend.
3. λ is a smoothing parameter that determines the degree of smoothness of the trend.
The smoothing parameter λ is typically set to a value between 100 and 1600, depending on the frequency of the data. Higher values of λ lead to a smoother trend, while lower values lead to a more volatile trend.
The HP filter has several advantages over other smoothing techniques. It is a non-parametric method, meaning that it does not make any assumptions about the underlying distribution of the data. It also allows for easy comparison of trends across different time series and can be used with data of any frequency.
However, the HP filter also has some limitations. It assumes that the trend is a smooth function, which may not be the case in some situations. It can also be sensitive to changes in the smoothing parameter λ, which may result in different trends for the same data. Additionally, the filter may produce unrealistic trends for very short time series.
Despite these limitations, the HP filter remains a valuable tool for analyzing economic and financial data. It is widely used by central banks and financial institutions to monitor long-term trends in the economy, and it can be used to identify turning points in the business cycle. The filter can also be used to analyze asset prices, exchange rates, and other financial variables.
The Hodrick-Prescott filter is a powerful tool for analyzing economic and financial data. It separates a time series into a trend component and a cyclical component, allowing for easy identification of long-term trends and turning points in the business cycle. While it has some limitations, it remains a valuable tool for economists, central banks, and financial institutions around the world.

NoanFam IndicatorNoan Indicator: A Simple Manual for Beginners
Welcome to the Noan Indicator manual!
This guide will help you understand how to use the Noan Indicator for your trading needs, even if you have little to no knowledge of trading.
The Noan Indicator is a versatile tool that can be applied to different trading strategies, such as 123 patterns, trend breaks, or sudden large price movements.
How to Start the Indicator:
1. Determine 2% risk:
The first step is to determine the risk you're willing to take for a particular trade.
We recommend a 2% risk, meaning you should not risk more than 2% of your account balance on any single trade.
a. Enter Portfolio Size: Enter the total value of your trading portfolio. This value will be used to calculate the trade size based on the percentage risk you're willing to take.
b. Enter Leverage Multiplier: Enter the leverage multiplier you are using for your trades. This value will be used to adjust the trade size accordingly.
c. Split amount to trade (Entry-DCA): Select the desired percentage split for your initial trade entry and dollar-cost averaging (DCA) trade. You can choose between 60/40, 50/50, or 100% (no DCA).
2. Identify a trade opportunity:
Analyze the market, using technical and/or fundamental analysis, to identify potential trade opportunities. Look for patterns, trends, support and resistance levels, and other indicators that signal the right time to enter a trade. Remember that the Noan Indicator is designed to assist you in managing risk, and it is not a standalone trading strategy. Always use your own research and judgement when making trading decisions.
After conducting your research and finding a good point to enter, input the trade type (long or short) into the indicator.
3. Set entry price:
The entry price should be based on your analysis and represents the price at which you would like to enter the market.
It is essential to set a realistic entry price, taking into consideration the current market conditions and price action.
After conducting your own research and identifying a good entry point for a long or short trade, input the Entry Price into the Noan Indicator.
4. Preferences:
The Noan indicator is set default with a Dollar Cost Averaging (DCA) area.
You can choose to disable this feature if desired.
Also an option to choose whether you want to see the values ($) or percentages (%) for the different levels in the indicator.
5. Select a predefined Trail Stop Loss:
If a trailing stop loss option is selected in the settings, a line will be displayed on the chart, showing the level where the stop loss will be moved based on the chosen option.
Protect your investment and help manage risk during the trade.
It allows you to limit your losses while allowing your profits to run.
Move Stop Loss to Average Entry: The stop loss moves to your average entry price (considering DCA) once the market reaches a specific level.
Move Stop Loss to Entry: The stop loss moves to your initial entry price.
Move Stop Loss to TP1 after DCA: The stop loss moves to the first Take Profit level after executing the DCA.
Move Stop Loss to TP1, TP2, TP3, or LTPR: The stop loss moves to the specified Take Profit level or Last Trailing Profit Range.
6. Set alerts:
Set up alerts for when the indicator reaches specific levels or when other conditions are met.
This will help you stay informed about potential trading opportunities.
To set up alerts using the Noan Indicator v2.7.0:
a. Right-click on the chart and select "Add Alert" or click the "Alerts" tab in the left sidebar and click the "+" button.
b. In the "Condition" dropdown menu, select the "Noan Indicator v2.7.0" script.
c. Choose the alert type by selecting a condition from the available options (e.g., crossing, greater than, less than, etc.).
d. Specify the alert settings, such as the alert name, message, and frequency.
e. Click "Create" to create the alert.
What Makes This Indicator Unique?
The Noan Indicator is designed to suit various trading strategies and can help confirm a setup after thorough research or upon reaching a Point of Interest (POI). By inputting a pre-examined entry price, the indicator will display different potential levels for Take Profits (TPs), Dollar-Cost Averaging (DCA), and Stop Loss (SL) areas. These levels are based on fixed percentages derived from data collected from thousands of trades.
If the different levels correspond well with past price levels, this can provide an extra point of confirmation for your trading decision. The TPs, DCA, and SL areas at these levels are structured according to the Noan Theory, further enhancing the effectiveness of the indicator.
In summary, the Noan Indicator is a versatile and powerful tool that can help traders of all levels make more informed decisions, regardless of their trading strategy. By following this simple manual, you can start using the Noan Indicator to improve your trading performance.

Harmonic ScannerThe concept of harmonic patterns was introduced in H.M. Gartley's book "Profits in the Stock Market" around 1935. Gartley formation was based on XABCD framework with particular values from Fibonacci values set. With only XABCD frame and Fibonacci values we have over 4 000 atomic combinations. Gartley formation is composed from two atomic combinations. Since then, numerous other combinations have been proposed and can be found on various internet sources. Our objective is not only to utilize known combinations, but also to develop a methodology for identifying combinations that best fit the price changes of a particular financial instrument.
The Harmonic Scanner searches for popular harmonic patterns on a chart and tracks them using typical take profit and stop loss values. The script calculates ideal efficiency by entering a position at the D point and exiting either on the stop loss or at the highest take profit value.
Furthermore, you can enable the "relaxed formations" feature to search for generalized variants of the patterns.
This script can be used by any user. There is no need to have a PRO or PREMIUM account.
Harmonic Scanner is just one component of larger "Harmonic" package, which is designed to simplify the use of the ideas proposed by Gartley and to customize them for various financial instruments.
The Harmonic package includes:
⠀⠀Harmonic Scanner - A classic harmonic patterns detector that checks efficiency by entering in D point and trading move to the take profit value.
⠀⠀Harmonic Predictor - A harmonic pattern detector that checks efficiency by entering at the C point and trading the move to the D point.
⠀⠀Harmonic Scanner TakeProfitMap - A supporting script for scanner, that tracks highest potencial profits from historical transactions to better determine the appropriate take profit values for a given financial instrument.
⠀⠀More components is under developement...
If you prefer a video explanation, please refer to the "HowTo: Harmonic Idea" video.
Script with limited access, contact author to get authorization
Script settings:
Extreme area - Specifies the range in which low/high need to be the lowest/highest bar to be counted as XABCD point.
XA limit - Specifies the maximum distance between successive points in XABCD formation pattern.
Inaccuracy ‰ - It determines the maximum deviation from the conditions that must be met by the pattern. Larger value will produce more duplicates.
Relaxed formations - Formations marked with * will be relaxed on CBD retracement.
Eliminate duplicates - Eliminates formation duplicates. We can precise the maximum deviation of results that are threaded as the same (duplicates).
Verify Predictor - Special mode what can be used to verify results from the Harmonic Predictor script.
List of formations, each letter enables specific formation.
Visualization section with independent settings for the folowing groups:
- Estimated formations ( high or low are still unconfirmed but their confirmation will add new formations),
- Positions (formations tracked for statistics)
- Traded (xlosed positions, either on take profit or stop loss)
For each group of formations following settings can be customized:
- Color used for drawing formation shape
- Checkbox for enabling/disabling shape visualization
- Checkbox for enabling/disabling target visualization
- Picker for selecting the label type
⠀⠀- h(ide)
⠀⠀- s - Labels with small font
⠀⠀- S - Labels with normal font
ShapeBox - Displays a box over formations with the formation name (useful for identifying specific formations).
Color settings - Customize the color of filled and unfilled targets.
Transparency settings - Adjust the transparency of formation shapes and targets.
Statistics - Picker for statistics table type:
H(ide) - Hides the statistics table.
P(ositions) - Shows a list of positions with their corresponding stop loss and take profit values. Take profit values that have been reached are highlighted.
% - Displays the efficiency of formations, split by take profit values.
%W - Displays the efficiency of formations, split by take profit values and weighted by formation size.
Position filter - A filter that works with the P(ositions) statistics.
Troubleshooting:
In case of any problems, please send error details to the author of the script.

Harmonic PredictorThe concept of harmonic patterns was introduced in H.M. Gartley's book "Profits in the Stock Market" around 1935. Gartley formation was based on XABCD framework with particular values from Fibonacci values set. With only XABCD frame and Fibonacci values we have over 4 000 atomic combinations. Gartley formation is composed from two atomic combinations. Since then, numerous other combinations have been proposed and can be found on various internet sources. Our objective is not only to utilize known combinations, but also to develop a methodology for identifying combinations that best fit the price changes of a particular financial instrument.
The Harmonic Predictor is predicting XABCD formations based on XABC chart patterns and simulate trading with price move between points C and D. It's the second way of using harmonic patterns in trading. The script calculates ideal efficiency by entering a position at the C point and exiting either on the stop loss or point D - the take profit value.
Furthermore, you can enable the "relaxed formations" feature to search for generalized variants of the patterns.
This script can be used by any user. There is no need to have a PRO or PREMIUM account.
Harmonic Predictor is just one component of larger "Harmonic" package, which is designed to simplify the use of the ideas proposed by Gartley and to customize them for various financial instruments.
The Harmonic package includes:
⠀⠀Harmonic Scanner - A classic harmonic patterns detector that checks efficiency by entering in D point and trading move to the take profit value.
⠀⠀Harmonic Predictor - A harmonic pattern detector that checks efficiency by entering at the C point and trading the move to the D point.
⠀⠀Harmonic Scanner TakeProfitMap - A supporting script for scanner, that tracks highest potencial profits from historical transactions to better determine the appropriate take profit values for a given financial instrument.
⠀⠀More components is under developement...
If you prefer a video explanation, please refer to the "HowTo: Harmonic Idea" video.
Script with limited access, contact author to get authorization
Script settings:
Extreme area - Specifies the range in which low/high need to be the lowest/highest bar to be counted as XABCD point.
XA limit - Specifies the maximum distance between successive points in XABCD formation pattern.
Inaccuracy ‰ - It determines the maximum deviation from the conditions that must be met by the pattern. Larger value will produce more duplicates.
Relaxed formations - Formations marked with * will be relaxed on CBD retracement.
List of formations, each letter enables specific formation.
Visualization section with independent settings for the folowing groups:
- Estimated formations ( high or low are still unconfirmed but their confirmation will add new potencial formation),
- Potencial (formations tracked for statistics)
- Existing
For each group of formations following settings can be customized:
- Color used for drawing formation shape
- Checkbox for enabling/disabling shape visualization
- Checkbox for enabling/disabling target visualization
- Picker for selecting the label type
⠀⠀- h(ide)
⠀⠀- s - Labels with small font
⠀⠀- S - Labels with normal font
StopLoss - Displays stoploss value for potencial and Estiamted formations.
Hide not precised D - It is expected that the price will change direction in D points, but for some potencial formations price is reaching D point area and continue in the same direction. With this option, you can hide these formations.
Transparency settings - Adjust the transparency of formation shapes and targets.
Statistics - Picker for statistics table type:
H(ide) - Hides the statistics table.
P(ositions) - Shows a list of positions with their corresponding stop loss and take profit values. Take profit values that have been reached are highlighted.
% - Displays the efficiency of formations, split by take profit values.
%W - Displays the efficiency of formations, split by take profit values and weighted by formation size.
Position filter - A filter that works with the P(ositions) statistics.
Troubleshooting:
In case of any problems, please send error details to the author of the script.
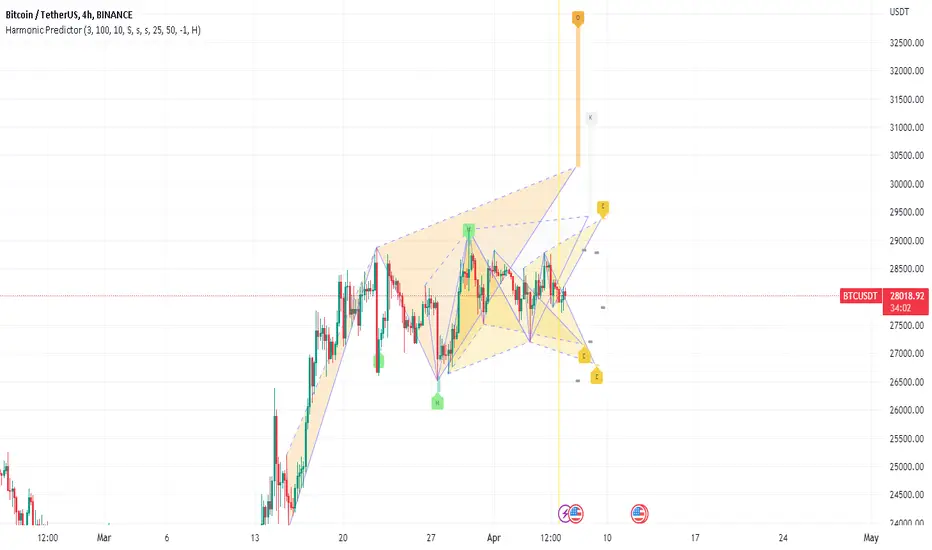
Diddly - Real Volume TrendDiddly Real Volume Trend is an indicator to help traders identify the real trending direction of an asset, it achieves this by using liquidity to assess the overall buying and selling volume sentiment of a market place.
What is Liquidity
Liquidity refers to the ability of an asset to be turned into cash. Cash is the more liquid form of any asset, whereas selling a house would take a little longer to liquidate and convert to cash. Liquidity in financial markets is in essence based on the same principle and refers to how easily an asset can be bought and sold.
Liquidity in simple terms is the volume of participants who are willing to be involved in the market at any given time. Markets are based on auction theory, the more participants who want to buy at a certain price than sell, will dictate that the price goes up. As a result it is important to understand the role that volume has in financial markets, as volume will directly correlate to liquidity and supply and demand.
What does it mean?
Although markets are based on auction theory, sadly we don't have the advantage of a traditional auction, where we are all sitting in a room putting our hands in the air when we are interested in paying x price for a particular item. In this environment it is very clear to see how popular the item for sale is and whether it is possible to pick up a bargain.
Being able to identify the prevailing direction of buying versus selling volume on a chart provides an insight into market sentiment. Also we have to consider that typically most retail traders participate in very liquid markets, where you can get in and out of a position with relative ease.
There are obviously exceptions, extremely low float stocks, but on the whole with liquid assets it takes some big orders to move price, especially with currencies and high float stocks. Understanding these principles helps us as retail traders identify where the big money is seeing a bargain, if buying or overpriced if selling.
However you identify liquidity, I hope you agree that it is an extremely important element to be considering before taking a trade. The last thing any trader wants to be doing if they can avoid it, is getting on the wrong side of the market.
Just as a side note, high and low "Float Stocks" refers to the number of shares in general circulation for buying and selling.
What is "Diddly Real Volume Trend"
This volume trend indicator in simple terms will display the combined accumulated bullish and bearish volume within a window below the main chart. What you will see is a line chart that will be doing one of three things. Either it could be stair stepping in an upwards direction, identifying that we are in a bullish trend or stepping down in a bearish trend. Alternatively it could just be going sideways, which would suggest a ranging market.
This enables traders to make an assessment of the market sentiment using the liquidity direction that it has identified. This can help form an overall daily bias for intra-day traders or help confirm a longer term trend for swing traders.
Although this indicator is not a true oscillator (where the limits of number are fixed between a known upper and lower limit) , it can still be extremely useful in identifying divergence in price and the volume sentiment. As well as assisting in the process of identifying and confirming peak formations and potential reversal points in a market.
How does it Work
The indicator is plotting the volume trend line based on the output of a set of volume calculations, which is confirmed on the close of each candle. The resultant output is either a positive (Bullish sentiment) or negative (Bearish Sentiment), which are all totalled up to show the next point on the graph. As a result the visual effect seen from this process is that the more bullish calculated volume identified than bearish, you will see a rising trend line and the reverse for a bearish market.
The algo calculation which is used on each candle and its related volume is using the following elements.
Volume
Rate of Change
Relative Strength
The indicator is not just looking at the volume total and saying this is a green candle and must provide a positive number. It is looking for the volume and liquidity extremes and filtering out the nothingness of a market that makes no difference to price either way. It is from using these extremes that the indicator is able to plot the activities and direction of the big money in the market.
What is the Indicator Showing me?
Examples:
Here on a stock VKTX, on a 1 minute chart the elements that make up the indicator are annotated on the chart.
There are 6 components highlighted in the above chart, these have been listed below.
Volume Trend Line
This is the indicator driving line and is the result of the calculations described in the previous section.
Fast Moving Average
This is the fast moving average of the "Volume Trend Line". The moving average type and length can be changed in the settings.
(Default = Exponential Moving Average, Length: 60)
Slow Moving Average
This is a slower moving average of the "Volume Trend Line". The moving average type and length can be changed in the settings.
(Default = Hull Moving Average, Length: 3500)
Long Term Moving Average
This is a long term moving average of the "Volume Trend Line". The moving average type and length can be changed in the settings.
(Default = Exponential Moving Average, Length: 400)
Bullish Confirmation
On the "Volume Trend Line", you will see coloured circles dotted along the line, the green circles signifying Bullish Confirmation.
Bearish Confirmation
On the "Volume Trend Line", you will see coloured circles dotted along the line, the red circles signifying Bearish Confirmation.
The Bullish and Bearish confirmation signals are not signals to take trades, they are there to highlight the predominant direction. Seeing one confirmation signal in isolation is not that helpful, but continued prints of confirmation in a single direction would be interesting.
There are a further two signal types that are displayed on the volume trend line, these should be seen infrequently across charts and represent potential extremes of price movement in a single direction. These signals act as a warning that price could stall in this area or potentially make a reversal. As with the other signals within this indicator they are not signals to buy or sell, they are there to provide warning alerts and should be considered with other pieces of information that you are working with.
Bullish Extreme
Plotted on the "Volume Trend Line", you will occasionally see a green coloured downwardly pointing triangle, this represents a Bullish Extreme.
GBPAUD Hourly chart October 2022
Bearish Extreme
Plotted on the "Volume Trend Line", you will occasionally see a red coloured upward pointing triangle, this represents a Bearish Extreme.
GBPAUD Daily chart (February - April) 2023
How Does It Help?
This indicator will compliment any existing strategy and is not intended to be used standalone.
It can be used on any chart from a monthly, one minute to one second, depending on your trading strategy. Using multiple time frame analysis can help traders with a number of decisions that need to be considered before taking entries.
What is my market direction bias?
This can be taken from an hourly for intraday trader or daily for swing traders. What that time frame is depends on your trading plan and objectives from the trades you take.
When do I take my trades?
Again depending on the trading strategy used will dictate many aspect of this decision, although using the volume trend on a lower time frame, can help confirm breakouts, reversals and divergence.
How should I manage my trade?
With any trade you should have a defined risk reward clearly defined, with stops and targets in mind before taking an entry.
The age old saying of "cut your losses quickly and let your winner run", is easier said than mastered. Once in a trade the volume trend can be really helpful to identify trades that could be real runners and allows you to change expectations after entering the trade. Maybe you want to take some profit at the original point and let the remaining run. Maybe there is such strength you want to add to the position. Being able to assess market sentiment once in a trade can help with optimising returns.
The "Volume Trend Line", which is the driving element of this indicator, will be doing one of three things. Either it could be stair stepping in an upwards direction, identifying that we are in a bullish trend, stepping down in a bearish trend or going sideways in a ranging market.
Bullish Volume Trending Market
Here is stock VKTX, on a 1 minute chart. Trend confirmation on price action is determined by Higher Highs and Higher Lows for an uptrend or Lower Lows and Lower Highs on a downtrend. The same principle applies for the volume trend line.
In this example we first see breakout volume on the indicator with the Bullish Break volume, following that the volume trend keeps making higher highs and higher lows, confirming that this asset has short-term upwards potential. (why short-term? this is the 1 minute chart, you would want to consult the daily or hourly for a longer term perspective).
Price also is making higher highs and higher lows, which is in alignment with the indicator and known as "convergence" and is a positive signal for a continued trend.
Bearish Market
So here on Tesla (TSLA) on the 4 hour chart we can see the big sell off that started in April 2022. Where it clearly shows a downward trend, with lots of confirmation for continuation.
Ranging Markets
On this example on the AUDJPY 1 Hour chart, we can see that price is in a ranging market. By drawing trend lines on price and the indicator, it is clear to see that price and the volume trend line are both showing a ranging market. What is more interesting is the structure of the ranges.
The price range at the top of the chart is in an upward direction, whereas the volume trend in the bottom window is showing a downward range. Giving us an early indication of what to expect from this asset.
Diverging Markets
"Divergence" is a very powerful mechanism for identifying potential reversal points in price actions. There is a wealth of published information on this topic which is well worth reviewing, if this is a new principle to you.
Here again on the same AUDJPY 1 Hour chart example, points of interest have been annotated on the chart where the historical range turns into a step down to the next level within the market cycle, as predicted by the divergence in range patterns, price point up and volume pointing down.
In the above example, after identifying the divergence the next most important element is an extremely fast accelerated move down which breaks the lower level of the range, this can be seen on the right side of the bottom window and is labelled "Bearish Breaking Volume".
What is interesting here is that the volume indicator has identified the range breakout when price was still above the lower level of the range. Following that break out volume signal, if we zoom out to a 4 hour chart to see what happened next.
The range breakout was confirmed and price and the volume trend continues to show a downward direction in the market. As for entries and stops that is not the intention of this indicator and will be down to other elements in your trading strategy or in our case other indicators.
Peak Formations
Peak formation refers to the point where an asset is over extended in one direction and there is a potential of change in direction, with a wider pullback or a reversal in the higher time frame trend. These formations are often seen with double bottoms (W patterns) or double tops (M patterns) . Unfortunately these patterns appear all over the chart and trading them in isolation will be challenging.
In this example of EURJPY on the 1 hour chart, we see price and the indicator in the bottom window for the first 3 weeks in March 2022. The pair is trending down which is confirmed by both price and the indicator. There are no signals points plotted on the volume trend line, until one appears on March 4th 2022.
Another one appeared on the next trading day of Monday the 7th and we now have these two signals relatively close to each other. This is interesting information, especially considering that there was no extreme signals for the previous couple of months.
Later that day the volume trend broke the previous volume level, after a W pattern was completed and a green bullish confirmation signal was printed. The following day another bullish confirmation signal is displayed to further confirm that we had made a peak formation reversal.
Please note that using the settings style tab, has enabled the change to the bearish extremes signal, changing the colour and shape to be an orange circle. Which for the purposes of this illustration is easier to see.
Another example of the same pair in August 2022, with a very similar confirmation sequence.
Stock Examples
Here on UBER on a 1 hour chart , is an example of how the indicator can be used in confluence with other trading strategies. If a trader was trading candle patterns, they may see this classic 1 hour bull flag pattern forming.
Without the volume trend analysis this looks like a good buy setup. Adding this analysis to the chart we clearly have a different view point.
Here is what subsequently happened to price and this is in a generally bullish market March 2023.
Scalping Entries
For those traders who work with super fast time frames like the 5 second or even on a 1 second charts, the volume indicator can be used to help time entries as a part of a wider trading strategy of trading a pullback or trading support and resistance levels.
Styling options in the indicator settings enabled this different view of the indicator output, which can be extremely useful for timing entries.
Here on this hot IPO stock, LUNR from February 16th 2023, we have an extremely strong move up from $13.80 to $18.00. One aspect of this move up, is that it is doing this on extremely light volume and the predominant market sentiment on the surface seems very bearish.
This would be a clear indication not to trade this stock at this moment in time, as a trader there would be lots of emotions of FOMO (fear of missing out) , seeing a stock making that kind off move on a new IPO - there is the sense that this stock will go to the moon and your not going to be involved.
As traders we have to consider the risk : reward potential. This stock could drop to $10.00 if someone put in a 50 k market sell order, as it is clear there are not the buyers to support that kind of liquidation.
The following charts are in the 5 second time frame, until otherwise stated
So we need to wait for some confirmation of buying liquidity before we can make any plans for taking an entry, which we get in the form of a couple of strong bullish candles on the chart below. Interestingly the price breaks the previous all time high for this stock, although the volume trend at this stage does not seem strong enough to consider an entry.
At this point we should be on the lookout for further buying liquidity, ideally to break the previous high volume line, which appears in the next chart. This would be the time to take an entry based on other aspects of a trading plan.
Having now taken an entry, we can use the indicator to understand the strength of the buying liquidity and identify areas where we should be looking to take profit or close out the trade. Looking at the volume trend profile shown in the chart below, there is no reason not to hold this stock for a wider move up.
In the next chart we see the first signs of some selling pressure, as the indicator shows signs of red. This would be the area to take some profit and look at a higher time frame perspective, to get the sense of whether to hold the remaining position.
Here on the 5 minute time frame the volume trend is still looking very strong to hold the remaining position. As it turned out it was a good place to take profit as it was just under the high of the day.
Knowing when an asset is going to reverse is not easy and this stock was way too over extended and a top had to finally come. This one minute view of the indicator, shows the point where you would see that the upward liquidity was over and you were now on the backside of the move, with no reason to trade further.
Here on a 15 minute chart you can see the full extent of the move and its reversal back to the original price. It provides a clear illustration that chasing trades through FOMO or holding and hoping is not a profitable approach. Being able to time your entries and exits, where you can clearly manage risk is one of the most important elements to any traders strategy.
This is an extreme example and not something you see every day in any market. It has been included within this narrative with the hope that it clearly illustrates the risk involved in trading and being able to mitigate them, has to be at the forefront of your mind.
Key Settings
Within the indicator settings there are a number of options that are available to users. All aspects of what you can see can either be changed or turned on or off in the "Style" tab as well as changing the colours and their transparency.
The available settings on the "Inputs" tab are for fine tuning the indicator to your style of trading. This fine tuning can be applied to the moving averages that can be displayed and follow the volume trend line as well as the volume filtering process.
The most important ones that are in need of explanation are outline below:
General Settings
"What type of asset is the Algo looking at" : Available Options = "Small Caps", "Large Caps", "Futures", "Currencies" (Default Setting = Currencies)
The indicator will make an assessment of the best settings to use as defaults for the volume filtering, confirmation and extremes signals. The defaults can be changed in the following sections using the override.
"Turn on Turbo Mode" : True or False (Default Settings = True)
This setting will give the indicator volume filtering processes a boost
Signal Settings
Based on the "Asset Type" from the general settings, the indicator will make an assessment of the best settings to use by default. These can be changed by using the settings below.
"Override Default Assessment Thresholds" = True / False
"Percentage Difference to Signify Trend Confirmation" = A percentage value that will tell the indicator how to identify the volume trend line swing points used to identify bullish or bearish confirmation signals. Values from 0.1 to 10 would make the most sense. A too high setting and you will not see any confirmation points plotted. Too low and you may see too many to be useful.
"Percentage Difference to Signify Extremes" = A percentage value that will tell the indicator how to identify the volume trend line swing points used to identify bullish or bearish confirmation signals. Values from 20 to 200 would make the most sense. A low a setting and you will see too many extreme points plotted.
Filter Settings
"Turn On Volume Assessment Filters" = True / False : The volume assessment filters are used to focus the "volume trend line" on higher volume extremes.
Based on the "Asset Type" from the general settings, the indicator will make an assessment of the best settings to use by default. These can be changed by using the settings below.
"Override Default Assessment Filters" = True / False
"Filter Volume using Setting" = The number used in this setting represents a value from 0 to 100. Zero will filter out no volume, whereas 100 would filter it all out. The default setting is 1, as there is a danger of setting this number too high and all you will see in the line chart is big steps up and down, with a plateaus in the middle. Which may be useful, although it would not be so helpful in divergence or volume line breaks.
Fast Moving Average
This is the fast moving average of the "Volume Trend Line".
"Moving Average Type" = The type of moving average calculation to be applied.
Default = "EMA"
Available Options: "SMA","EMA" ,"HMA" ,"SMMA (RMA)" ,"WMA" ,"VWMA"
Moving Average Key
SMA : Simple Moving Average
EMA : Exponential Moving Average
HMA : Hull Moving Average
SMMA (RMA) : Exponentially Weighted Moving Average (alpha = 1 / length.)
WMA : Weighted Moving Average
VWMA : Volume Weighted Moving Average
"Moving Average Length" = The number of candles back into the chart used to calculate the Moving Average. (The higher the number, the slower the moving average becomes)
Default Length = 60
"Apply Double Smoothing" = True or False : This is an option to turn on if an extra smoothing effect to the moving average if required.
Slow Moving Average
This is the slow moving average of the "Volume Trend Line".
"Moving Average Type" = The type of moving average calculation to be applied.
Default = "HMA"
Available Options: "SMA","EMA" ,"HMA" ,"SMMA (RMA)" ,"WMA" ,"VWMA"
(See moving average key)
"Moving Average Length" = The number of candles back into the chart used to calculate the Moving Average. (The higher the number, the slower the moving average becomes)
Default Length = 3500
(By default we have a higher number for the slow length compared to the long term length in the next setting. This is because using the Hull Moving Average, is an accelerated moving average that needs higher values to slow it down. If you were to change this to say an EMA, then you would need to change the length to something like 200, to put this slower moving average in context with the others).
Long Term Moving Average
This is a long term moving average of the "Volume Trend Line".
"Moving Average Type" = The type of moving average calculation to be applied.
Default = "EMA"
Available Options: "SMA","EMA" ,"HMA" ,"SMMA (RMA)" ,"WMA" ,"VWMA"
(See moving average key)
"Moving Average Length" = The number of candles back into the chart used to calculate the Moving Average. (The higher the number, the slower the moving average becomes)
Default Length = 400
"Apply Double Smoothing" = True or False : This is an option to turn on if an extra smoothing effect to the moving average if required.
Finally
We greatly appreciate the support and feedback from the Trading View community, and we are dedicated to continuing to improve our indicators with your support.
We want to help you manage risk, and that's why we emphasise that trading is risky and any technology used to support our trading decisions is based on information from the past. We encourage traders to take responsibility for their trading businesses and always prioritise risk management.

GKD-C Variety RSI [Loxx]Giga Kaleidoscope Variety RSI is a Confirmation module included in Loxx's "Giga Kaleidoscope Modularized Trading System".
█ Giga Kaleidoscope Modularized Trading System
What is Loxx's "Giga Kaleidoscope Modularized Trading System"?
The Giga Kaleidoscope Modularized Trading System is a trading system built on the philosophy of the NNFX (No Nonsense Forex) algorithmic trading.
What is an NNFX algorithmic trading strategy?
The NNFX algorithm is built on the principles of trend, momentum, and volatility. There are six core components in the NNFX trading algorithm:
1. Volatility - price volatility; e.g., Average True Range, True Range Double, Close-to-Close, etc.
2. Baseline - a moving average to identify price trend
3. Confirmation 1 - a technical indicator used to identify trends
4. Confirmation 2 - a technical indicator used to identify trends
5. Continuation - a technical indicator used to identify trends
6. Volatility/Volume - a technical indicator used to identify volatility/volume breakouts/breakdown
7. Exit - a technical indicator used to determine when a trend is exhausted
How does Loxx's GKD (Giga Kaleidoscope Modularized Trading System) implement the NNFX algorithm outlined above?
Loxx's GKD v1.0 system has five types of modules (indicators/strategies). These modules are:
1. GKD-BT - Backtesting module (Volatility, Number 1 in the NNFX algorithm)
2. GKD-B - Baseline module (Baseline and Volatility/Volume, Numbers 1 and 2 in the NNFX algorithm)
3. GKD-C - Confirmation 1/2 and Continuation module (Confirmation 1/2 and Continuation, Numbers 3, 4, and 5 in the NNFX algorithm)
4. GKD-V - Volatility/Volume module (Confirmation 1/2, Number 6 in the NNFX algorithm)
5. GKD-E - Exit module (Exit, Number 7 in the NNFX algorithm)
(additional module types will added in future releases)
Each module interacts with every module by passing data between modules. Data is passed between each module as described below:
GKD-B => GKD-V => GKD-C(1) => GKD-C(2) => GKD-C(Continuation) => GKD-E => GKD-BT
That is, the Baseline indicator passes its data to Volatility/Volume. The Volatility/Volume indicator passes its values to the Confirmation 1 indicator. The Confirmation 1 indicator passes its values to the Confirmation 2 indicator. The Confirmation 2 indicator passes its values to the Continuation indicator. The Continuation indicator passes its values to the Exit indicator, and finally, the Exit indicator passes its values to the Backtest strategy.
This chaining of indicators requires that each module conform to Loxx's GKD protocol, therefore allowing for the testing of every possible combination of technical indicators that make up the six components of the NNFX algorithm.
What does the application of the GKD trading system look like?
Example trading system:
Backtest: Strategy with 1-3 take profits, trailing stop loss, multiple types of PnL volatility, and 2 backtesting styles
Baseline: Hull Moving Average as shown on chart
Volatility/Volume: Waddah Attar as shown on chart
Confirmation 1: Variety RSI as shown on the chart above
Confirmation 2: Williams Percent Range
Continuation: Fisher Transform
Exit: Rex Oscillator
Each GKD indicator is denoted with a module identifier of either: GKD-BT, GKD-B, GKD-C, GKD-V, or GKD-E. This allows traders to understand to which module each indicator belongs and where each indicator fits into the GKD protocol chain.
Giga Kaleidoscope Modularized Trading System Signals (based on the NNFX algorithm)
Standard Entry
1. GKD-C Confirmation 1 Signal
2. GKD-B Baseline agrees
3. Price is within a range of 0.2x Volatility and 1.0x Volatility of the Goldie Locks Mean
4. GKD-C Confirmation 2 agrees
5. GKD-V Volatility/Volume agrees
Baseline Entry
1. GKD-B Baseline signal
2. GKD-C Confirmation 1 agrees
3. Price is within a range of 0.2x Volatility and 1.0x Volatility of the Goldie Locks Mean
4. GKD-C Confirmation 2 agrees
5. GKD-V Volatility/Volume agrees
6. GKD-C Confirmation 1 signal was less than 7 candles prior
Continuation Entry
1. Standard Entry, Baseline Entry, or Pullback; entry triggered previously
2. GKD-B Baseline hasn't crossed since entry signal trigger
3. GKD-C Confirmation Continuation Indicator signals
4. GKD-C Confirmation 1 agrees
5. GKD-B Baseline agrees
6. GKD-C Confirmation 2 agrees
1-Candle Rule Standard Entry
1. GKD-C Confirmation 1 signal
2. GKD-B Baseline agrees
3. Price is within a range of 0.2x Volatility and 1.0x Volatility of the Goldie Locks Mean
Next Candle:
1. Price retraced (Long: close < close or Short: close > close )
2. GKD-B Baseline agrees
3. GKD-C Confirmation 1 agrees
4. GKD-C Confirmation 2 agrees
5. GKD-V Volatility/Volume agrees
1-Candle Rule Baseline Entry
1. GKD-B Baseline signal
2. GKD-C Confirmation 1 agrees
3. Price is within a range of 0.2x Volatility and 1.0x Volatility of the Goldie Locks Mean
4. GKD-C Confirmation 1 signal was less than 7 candles prior
Next Candle:
1. Price retraced (Long: close < close or Short: close > close )
2. GKD-B Baseline agrees
3. GKD-C Confirmation 1 agrees
4. GKD-C Confirmation 2 agrees
5. GKD-V Volatility/Volume Agrees
PullBack Entry
1. GKD-B Baseline signal
2. GKD-C Confirmation 1 agrees
3. Price is beyond 1.0x Volatility of Baseline
Next Candle:
1. Price is within a range of 0.2x Volatility and 1.0x Volatility of the Goldie Locks Mean
3. GKD-C Confirmation 1 agrees
4. GKD-C Confirmation 2 agrees
5. GKD-V Volatility/Volume Agrees
█ Variety RSI
This indicator contains 7 different types of RSI.
RSX
Regular
Slow
Rapid
Harris
Cuttler
Ehlers Smoothed
What is RSI?
RSI stands for Relative Strength Index. It is a technical indicator used to measure the strength or weakness of a financial instrument's price action.
The RSI is calculated based on the price movement of an asset over a specified period of time, typically 14 days, and is expressed on a scale of 0 to 100. The RSI is considered overbought when it is above 70 and oversold when it is below 30.
Traders and investors use the RSI to identify potential buy and sell signals. When the RSI indicates that an asset is oversold, it may be considered a buying opportunity, while an overbought RSI may signal that it is time to sell or take profits.
It's important to note that the RSI should not be used in isolation and should be used in conjunction with other technical and fundamental analysis tools to make informed trading decisions.
What is RSX?
Jurik RSX is a technical analysis indicator that is a variation of the Relative Strength Index Smoothed (RSX) indicator. It was developed by Mark Jurik and is designed to help traders identify trends and momentum in the market.
The Jurik RSX uses a combination of the RSX indicator and an adaptive moving average (AMA) to smooth out the price data and reduce the number of false signals. The adaptive moving average is designed to adjust the smoothing period based on the current market conditions, which makes the indicator more responsive to changes in price.
The Jurik RSX can be used to identify potential trend reversals and momentum shifts in the market. It oscillates between 0 and 100, with values above 50 indicating a bullish trend and values below 50 indicating a bearish trend. Traders can use these levels to make trading decisions, such as buying when the indicator crosses above 50 and selling when it crosses below 50.
The Jurik RSX is a more advanced version of the RSX indicator, and while it can be useful in identifying potential trade opportunities, it should not be used in isolation. It is best used in conjunction with other technical and fundamental analysis tools to make informed trading decisions.
What is Slow RSI?
Slow RSI is a variation of the traditional Relative Strength Index (RSI) indicator. It is a more smoothed version of the RSI and is designed to filter out some of the noise and short-term price fluctuations that can occur with the standard RSI.
The Slow RSI uses a longer period of time than the traditional RSI, typically 21 periods instead of 14. This longer period helps to smooth out the price data and makes the indicator less reactive to short-term price fluctuations.
Like the traditional RSI, the Slow RSI is used to identify potential overbought and oversold conditions in the market. It oscillates between 0 and 100, with values above 70 indicating overbought conditions and values below 30 indicating oversold conditions. Traders often use these levels as potential buy and sell signals.
The Slow RSI is a more conservative version of the RSI and can be useful in identifying longer-term trends in the market. However, it can also be slower to respond to changes in price, which may result in missed trading opportunities. Traders may choose to use a combination of both the Slow RSI and the traditional RSI to make informed trading decisions.
What is Rapid RSI?
Same as regular RSI but with a faster calculation method
What is Harris RSI?
Harris RSI is a technical analysis indicator that is a variation of the Relative Strength Index (RSI). It was developed by Larry Harris and is designed to help traders identify potential trend changes and momentum shifts in the market.
The Harris RSI uses a different calculation formula compared to the traditional RSI. It takes into account both the opening and closing prices of a financial instrument, as well as the high and low prices. The Harris RSI is also normalized to a range of 0 to 100, with values above 50 indicating a bullish trend and values below 50 indicating a bearish trend.
Like the traditional RSI, the Harris RSI is used to identify potential overbought and oversold conditions in the market. It oscillates between 0 and 100, with values above 70 indicating overbought conditions and values below 30 indicating oversold conditions. Traders often use these levels as potential buy and sell signals.
The Harris RSI is a more advanced version of the RSI and can be useful in identifying longer-term trends in the market. However, it can also generate more false signals than the standard RSI. Traders may choose to use a combination of both the Harris RSI and the traditional RSI to make informed trading decisions.
What is Cuttler RSI?
Cuttler RSI is a technical analysis indicator that is a variation of the Relative Strength Index (RSI). It was developed by Curt Cuttler and is designed to help traders identify potential trend changes and momentum shifts in the market.
The Cuttler RSI uses a different calculation formula compared to the traditional RSI. It takes into account the difference between the closing price of a financial instrument and the average of the high and low prices over a specified period of time. This difference is then normalized to a range of 0 to 100, with values above 50 indicating a bullish trend and values below 50 indicating a bearish trend.
Like the traditional RSI, the Cuttler RSI is used to identify potential overbought and oversold conditions in the market. It oscillates between 0 and 100, with values above 70 indicating overbought conditions and values below 30 indicating oversold conditions. Traders often use these levels as potential buy and sell signals.
The Cuttler RSI is a more advanced version of the RSI and can be useful in identifying longer-term trends in the market. However, it can also generate more false signals than the standard RSI. Traders may choose to use a combination of both the Cuttler RSI and the traditional RSI to make informed trading decisions.
What is Ehlers Smoothed RSI?
Ehlers smoothed RSI is a technical analysis indicator that is a variation of the Relative Strength Index (RSI). It was developed by John Ehlers and is designed to help traders identify potential trend changes and momentum shifts in the market.
The Ehlers smoothed RSI uses a different calculation formula compared to the traditional RSI. It uses a smoothing algorithm that is designed to reduce the noise and random fluctuations that can occur with the standard RSI. The smoothing algorithm is based on a concept called "digital signal processing" and is intended to improve the accuracy of the indicator.
Like the traditional RSI, the Ehlers smoothed RSI is used to identify potential overbought and oversold conditions in the market. It oscillates between 0 and 100, with values above 70 indicating overbought conditions and values below 30 indicating oversold conditions. Traders often use these levels as potential buy and sell signals.
The Ehlers smoothed RSI can be useful in identifying longer-term trends and momentum shifts in the market. However, it can also generate more false signals than the standard RSI. Traders may choose to use a combination of both the Ehlers smoothed RSI and the traditional RSI to make informed trading decisions.
Requirements
Inputs
Confirmation 1 and Solo Confirmation: GKD-V Volatility / Volume indicator
Confirmation 2: GKD-C Confirmation indicator
Outputs
Confirmation 2 and Solo Confirmation: GKD-E Exit indicator
Confirmation 1: GKD-C Confirmation indicator
Continuation: GKD-E Exit indicator
Additional features will be added in future releases.

Range Band (Expo)█ Overview
Range Band (Expo) measures an asset's volatility and price movements to plot the most relevant price range. Identifying ranges in trading is extremely important for traders to assess the current market and make informed decisions about when to enter and exit positions.
By identifying ranges, traders can identify support and resistance levels , and use these levels to determine when to enter and exit a trade. Ranges also help traders to identify potential entry and exit points and set stop-loss and take-profit levels. Additionally, ranges can help traders to identify potential trends and reversals .
█ How to use
Identify potential trading opportunities
For example, if the price is bouncing between the upper and lower range bands, it may indicate that traders could potentially profit from short-term contrarian trades. Similarly, if the price is trading near the upper or lower range band, it may indicate that traders could potentially profit from long-term trend trades.
Price Ranges and SR Levels
Range bands help traders identify price ranges that are likely to be profitable. It is a graphical representation of price movement and is typically used to identify support and resistance levels. Range bands are also used to identify potential entry and exit points.
Trends
Range bands are used in to identify trends.
Reversals
Range bands are used in technical analysis to identify potential reversal points.
Overbought and Oversold
When the price reaches the upper range band, it may indicate that the asset is overbought and that the price is likely to fall. When the price reaches the lower range band, it may indicate that the asset is oversold and that the price is likely to rise.
-----------------
Disclaimer
The information contained in my Scripts/Indicators/Ideas/Algos/Systems does not constitute financial advice or a solicitation to buy or sell any securities of any type. I will not accept liability for any loss or damage, including without limitation any loss of profit, which may arise directly or indirectly from the use of or reliance on such information.
All investments involve risk, and the past performance of a security, industry, sector, market, financial product, trading strategy, backtest, or individual's trading does not guarantee future results or returns. Investors are fully responsible for any investment decisions they make. Such decisions should be based solely on an evaluation of their financial circumstances, investment objectives, risk tolerance, and liquidity needs.
My Scripts/Indicators/Ideas/Algos/Systems are only for educational purposes!

Neon Juliet - PreviewThere is no TLDR, but there is a summary at the end. I strongly encourage to read full description before trying it out. Enjoy!
Background
=========
Having successful and adamant trading systems typically consists of two (oversimplified) elements: signals and risk management system. In most zero-sum games, such as trading, signals must offer an advantage against the market, and risk management system provides a safety mechanism to allow the system to exist in the future. Let me explain.
Say, I have a solid risk management system: it is diversified, with take profit and stop loss thresholds set for low risk, on average I trade less than 3% of my assets, and there’s a loss recovery mechanism, etc. Hypothetically, it’s pristine. Now, let’s trade this portfolio against a flip of a coin, essentially a signal that provides 50% probability of things turning out in my favour. How profitable is such system? My answer: it isn’t. I might be able to sustain this system for some time, but eventually this system is going to have to loosen risk restrictions to stay ahead of the commissions and borrowing costs, resulting in overtime detrimental trend.
Conversely, if the signals provide greater than 50% confidence of things turning out in my favour, but risk management is poor, I’d expect such system to end up in a disaster soon, perhaps after a few euphoric gains. (I’d isolate a top-notch signals, say >90% confidence, in another bucket, but this idealistic system is non-achievable in my practice, so I’ll leave it be)
Neon Juliet was developed to offer an advantage against given markets. Probabilities generated by this model are statistical historical outcomes. This model developed using only price action and is unable to consume any other data or price data across instruments. In other words, it doesn’t know anything you don’t see already on a chart.
Neon J performs best on complex instruments where there’s great diversity of actors and considerable daily volume .
Methodology
==========
In principle, Neon J is based on Bayes’ Theorem. Simply put, prior knowledge of price action ( aka patterns) provides basis for probability of future price action development (ex. long or short trend).
The training process is implemented outside of this script mainly due to Pine Script limitations. This script, however, contains inference portion of the model.
As input for training, daily candle data is used. From this data, feature engineering step of the training develops features, like price average divergence/convergence (think MACD ), price strength (think RSI , ADX ); multiple periods used to diversify long and short patterns. This is done to develop a “state” that is reflective of recent price development. Ex. what we’d call a trend is just a strong and consistent upward price action, but we’d need to look at most recent N candles and their pattern to know that.
Once features are developed, I train a model using Reinforcement Learning technique. Simply put, this technique allows an agent to interact with a trading simulator and take actions (ex. go long, go short, etc.). After many iterations, the agent learns conditions (patterns) that lead to positive outcomes and those that lead to negative outcomes. This learning is quantitative, which means there’s a way to tell which probabilities are strong and which are weak. These probabilities are indicated by this script.
Trained Neon J models are instruments-specific. Meaning, that model for DJI is not compatible with SP500 or any other instrument. Experimentally, I proved that such approach over-performs generalizable models (those that are trained on data from multiple instruments)
Neon J currently only support daily time frame. The limitation is purely practical to reduce the development load and model size.
Results
======
Tests show 60%-70% success rate (on average, some instruments are worse than that, some better) of individual signal when threshold is set to 0.3 (roughly equivalent to 65% probability). This is calculated with Pine Script Strategy with the following entry/exit rules:
Entry when individual signal (a dot) is above 0.3 (long) or below -0.3 (short)
Exit when 14-period smooth signal (a column) is above 0.0 (short exit) or below 0.0 (long exit)
No stop loss or take profit levels.
Pyramiding is set to 100 (to allow unrestricted action of all signals)
All trades are closed on last tested bar (to conclude all signals in-flight)
Percent Profitable is what we take as success rate in the context of this assessment. This number represents how many signals were profitable vs all signals actioned.
It is also worth noting that this assessment was performed on a time period previously unseen by the model. Simply put, we only train a model with data up until date X, then we test starting from date X onward. This ensures that the assessment is unbiased by the model already “knowing” the future. In practice, this gives confidence that future (unknown) market dynamics is going to be representative of our test results.
Be aware, the above “strategy” is not my recommended usage of this signal, it is simply an assessment technique that is meant to be as simple and unconstrained as possible.
How to use this script
================
The script calculates a probability. A term probability here is used in a loose form and means “a numeric value in roughly -1 to 1 space that represents the likelyhood of bullish or bearish price action”. Keep in mind that probability values can go over 1.0 or below -1.0. This is due to the fact that these value are normalized to -1/1 space using 95-percentile (this detail is largely unimportant for usability’s sake).
Indications
--------------
Dots (circles) indicate individual probability value on any given bar. Indicated value on a given bar indicates the probability of future price action. High (positive) values indicate high probability of long action in the future. Low (negative) values indicate high probability of short action in the future. You should interpret future as a gradient (a trend developing slowly over time) instead of being isolated to what’s immediately follows (ex. next bar)
Columns (histogram) provided as convenient view of smoothed probabilities of last N bars. This is controlled by the Smoothing parameter and defaults to 14.
Parameters
---------------
Model parameter is the backbone of this script. It is a required parameter and it is unique for each instrument. Example models provided at the end (see below). This parameter is a long 10000+ character representation of a model.
The script has two additional parameters for configuring interpretation: Threshold and Smoothing.
Threshold controls the level at which values change color (ex. above 0.3, turn neon blue, and below -0.3 turn neon purple).
Smoothing parameter provides a way to smooth out individual probabilities into a exponential moving average with the periods provided. This average is indicated using columns on the indicator.
Model expiration
----------------------
Models are valid for 1 month after training. This is done by design to prevent model deterioration. A month is proven to be a maximum period of time to hold model performance steady. After that, deterioration is likely to occur. Optimal time for model lifetime is 10 days (this is what I use for live trading), and of course most optimal (but unpractical for now) is to re-train daily.
Validity indicated with blue-tinted indicator background, while red-tinted background indicates expired period.
Preview
======
This script is released as a public script for anyone to try. My motives for this release are two-fold:
To subject the model to a variety of conditions, including traders with different experiences trading different instruments (subject to specific models offered of course). Essentially, my own testing is not enough to grasp a full breadths of scenarios. I’d like to harden it and understand where it is strong and where it might fall short (pun intended).
Get an idea on how Neon J might be useful when making trading decision. I tried to make the representation of the signals unconstrained and unopinionated, so there’s room to explore and experiment. I found that Neon J can be packaged in a number of different ways.
At this moment the script is closed-source. I might consider open-sourcing this script in future depending on how much feedback I get from this submission and whether it’d be deemed useful to others.
Summary
=======
Neon J is a set of probabilistic models for predicting future price action with ~65% accuracy. It indicates individual signals (circles) for probability of price action in a foreseeable future, while smoothed signals (columns) are provided for a more dynamic view of probable price action. Blue circle - strong long probability; Purple circle - strong short probability. Blue column - strong long trend ahead or in-progress; Purple column - strong short trend ahead or in-progress.
To use it, copy models below and provide them an input to “model” parameter when applying to a chart. Models are instrument-specific. Only daily (D) charts should be used.
The script is provided for evaluation purposes.
Models!
======
At last, here are the models (a piece of text you need to input in script parameters for each instrument)
TVC:DJI :
DJI|20121220|20221220|0.597,-0.032,0.0,-0.121,0.0,0.866,-0.046,0.0,-0.091,0.0|1.492,0.1,0.0,-0.162,0.0,-0.669,-0.037,0.0,-0.042,0.0|0.07,0.374,0.0,0.305,0.0,0.085,0.488,0.0,0.26,0.0|0.249,-0.257,0.0,0.529,0.0,-0.018,-0.233,0.0,0.502,0.0|0,10,10,10,10,10,10,10,10,10,10,10,10,10,10,10,10,10,10,10,10,10,10,10,10,10,10,10,10,10,10,10,10,30,10,10,10,10,10,10,10,30,10,10,10,10,10,10,30,30,10,10,10,10,60,10,10,10,20,10,40,10,10,10,80,10,10,60,10,10,10,10,10,10,20,10,10,10,10,10,10,10,10,20,20,10,10,10,10,10,10,20,10,10,10,10,10,10,10,10,20,10,10,10,10,10,10,10,10,10,10,10,10,10,10,10,10,10,10,10,10,10,10,10,10,10,10,10,10,10,10,20,10,10,10,20,10,10,10,20,10,10,10,10,20,10,20,10,10,10,10,10,10,10,10,10,10,10,10,10,10,10,10,10,10,10,10,10,10,10,10,10,10,10,30,10,10,10,10,20,50,10,10,10,10,10,10,30,10,10,10,10,10,10,10,30,10,10,10,10,10,10,10,10,10,10,10,10,10,10,30,10,10,10,10,10,10,10,10,10,10,10,10,10,10,10,10,10,10,20,10,10,10,10,10,10,10,20,10,10,10,10,10,10,10,10,10,20,30,10,10,10,10,10,50,10,10,10,10,60,10,10,10,10,10,40,10,10,10,10,10,20,30,10,10,10,10,60,10,10,10,10,10,20,10,10,10,10,10,10,10,40,10,10,10,10,10,10,10,30,10,10,10,10,10,10,10,20,10,10,10,10,10,10,10,10,10,30,10,10,10,10,10,10,10,40,10,10,10,10,10,10,40,10,10,10,10,10,50,10,10,10,10,10,50,10,10,10,10,50,10,10,10,10,10,40,10,10,10,10,10,10,40,10,10,10,10,10,10,40,10,10,10,10,10,10,10,30,10,10,10,10,10,10,10,20,20,10,10,10,10,10,10,10,20,10,10,10,10,10,10,10,40,10,10,10,10,10,10,40,10,10,10,10,10,10,30,10,10,10,10,10,10,40,10,10,10,10,10,40,10,10,10,10,10,10,10,30,10,10,10,10,10,10,20,20,10,10,10,10,10,10,10,10,10,10,10,10,10,10,10,10,10,10,10,10,10,10,10,10,10,10,10,10,10,10,10,10,10,10,10,10,10,10,10,10,10,10,10,10,10,10,10,10,10,20,10,10,10,10,10,10,10,10,10,10,10,10,10,10,10,10,10,10,10,10,10,10,10,10,10,30,10,10,10,10,10,10,10,20,10,10,10,10,10,10,20,10,10,10,10,10,10,10,10,10,10,10,10,10,10,10,10,10,10,10,10,10,10,10,10,10,10,10,10,10,10,10,20,10,10,10,10,10,10,10,20,10,10,10,10,10,10,10,10,20,20,10,10,10,10,10,10,10,20,10,10,10,10,10,10,10,10,10,10,10,10,10,10,10,10,10,30,10,10,10,10,10,10,40,10,10,10,10,10,20,20,10,10,10,10,10,10,40,10,10,10,10,10,10,10,10,30,10,10,10,10,10,30,20,10,10,10,10,10,20,20,10,10,10,10,10,10,10,10,30,10,10,10,10,10,10,10,10,10,10,10,10,10,10,10,10,10,20,10,10,10,10,10,10,10,30,10,10,10,10,10,10,40,10,10,10,10,10,10,40,10,10,10,10,10,50,10,10,10,10,20,40,10,10,10,70,10,10,10,10,60,10,10,10,10,10,10,40,10,10,10,10,10,10,10,10,20,10,10,10,10,10,10,10,30,10,10,10,10,10,10,40,10,10,10,10,10,10,40,10,10,10,10,10,50,10,10,10,10,70,10,10,10|-645,-188,-7,-97,-4,29,-18,90,60,-7,-30,117,-226,-82,-49,77,-245,53,78,221,-72,280,245,400,683,268,-74,-15,-106,-102,-3,251,302,536,47,3,-6,-179,-56,101,-62,172,176,98,-15,-71,-18,200,61,-249,-30,-38,1,94,-2,-9,47,79,-35,-15,34,-30,76,120,39,96,-47,-11,-61,-21,124,-704,0,-248,112,-193,143,-27,-14,133,170,-20,-17,-2,-120,61,-98,-32,-2,79,-2,109,-35,-16,132,-44,-63,-168,205,-28,919,235,-34,-53,-23,-243,-68,-26,-35,-54,60,-37,28,-91,-3,-21,-47,79,-127,229,61,59,-49,-139,-63,-43,91,201,-19,-80,-27,120,-122,-141,-100,-32,-25,-98,-27,50,-2,-65,-138,-7,-36,-9,53,-36,-36,-64,-11,216,-5,-664,-19,74,82,-83,-3,-66,21,386,-454,-1002,-282,-7,-52,-30,-9,-16,-148,-131,112,-484,-96,97,93,-13,-162,-49,38,31,-5,-199,-22,205,153,-29,14,-41,-222,-225,-145,107,70,-3,-8,-7,-20,-247,37,96,268,362,-95,706,-69,60,70,120,-34,-65,-152,-69,-7,69,-76,71,-5,384,109,-102,-484,-3,34,60,-20,380,244,678,292,-48,-2,-154,-17,-62,105,486,597,212,-26,-21,-310,-29,-22,-90,285,-204,-92,-290,-6,-516,-42,-16,127,-47,-7,-72,-247,76,-47,-13,43,-26,43,89,-38,30,-21,-106,-78,113,-19,-13,-8,-12,-12,362,247,-4,50,76,64,-14,-52,-16,-93,-172,53,-1,32,99,22,-75,-4,-9,31,70,116,-54,-61,-3,-55,-19,-15,176,143,-11,134,144,-11,-28,-47,-29,-136,-75,99,64,-9,-2,-24,-43,30,-161,-179,82,175,129,115,-71,-396,-202,101,-9,139,-6,-31,-312,-111,2,0,-234,-21,-52,-31,-12,-26,-37,-144,-23,68,23,-16,149,60,-64,10,-7,-8,46,210,393,-5,96,-56,89,48,475,176,20,-10,-31,-29,34,76,41,178,38,-32,-94,-33,76,-5,91,-15,123,72,-46,-13,-11,0,-37,-244,-161,155,-8,-3,165,23,77,16,-117,35,-74,-5,-107,-286,-24,-263,-14,-37,-5,-196,-290,-576,-188,41,-20,-98,-34,-45,-45,-242,40,60,-7,-10,-17,-43,73,48,-25,-8,-40,-27,-2,-5,42,73,-6,-23,8,-16,63,167,21,-99,-47,-119,-36,-59,192,158,115,123,54,-28,-1,-90,-169,-71,-72,114,156,-141,155,64,42,-88,69,-75,76,94,-4,65,102,152,-9,10,-17,-192,67,-10,-343,-90,-43,-106,12,-9,-79,-10,-73,-461,-509,-75,99,-57,0,-27,80,-156,-198,-642,-363,33,47,-28,-40,-43,-8,9,-27,-67,41,26,0,6,-49,-29,-60,32,70,34,-2,-9,-40,-240,-152,21,189,49,67,12,-12,-2,16,31,200,193,211,-150,-84,-45,58,75,44,260,128,105,-9,-11,-1,82,-94,184,-53,266,326,-55,-209,-9,54,85,308,-14,60,420,160,-39,-81,-17,-10,77,108,-28,257,-104,-53,-59,-128,-5,-13,8,119,-20,-130,-49,-9,-3,-23,-46,150,194,263,-214,-12,72,-6,-22,25,-10,290,-41,-21,-18,-1,-17,-42,-14,-21,0,-4,-23,-1,-1,-13,172,-9,224,86,-9,-2,-22,176,-6,33,186,-61,-187,-46,-33,94,172,0,16,-12,-37,59,103,118,194,1000,44,40,49,81,82,89,142,-34,-26,-2,-15,-19,0,271,-56,-45,-21,-96,-146,-5,-54,141,-11,-320,58,-23,-43,-14,-49,142,127,120,-285,-187,-102,-72,-11,-55,-25,44,52,-43,-13,20,-41,-23,-88,-25,-4,-23,11,-179,-9,96,-84,215,93,-5,-49,148,-2,-58,-14,24,-6,-33,-6,103,9,0,-61,-1,29,113,98,-97,-19,-52,87,-39,-146,-70,-72,-119,-844,-184,-45,-27,-96,-155,93,-56,-41,-20,-43,-63,-142,-89,263,66,21,-21,-32,-70,-70,-263,20,-99,-11,-32,-50,-122,-186,-159,-137,136,-77,-14,-814,-23,-22,-170,-137,-42,-36,-64,75,-123,-100,-53,68,133,124,-77,211,217,522|0,10,10,10,10,10,10,10,10,10,10,10,10,10,10,10,10,10,10,10,10,10,10,10,10,10,10,10,10,10,10,10,10,20,10,10,10,10,10,10,10,10,30,10,10,10,10,10,10,30,20,10,10,10,10,10,60,10,10,10,20,10,40,10,10,10,30,50,10,10,50,10,10,10,10,10,10,10,20,10,10,10,10,10,10,10,10,20,10,20,10,10,10,10,10,10,10,10,10,10,10,10,10,10,10,20,10,10,10,10,10,10,10,10,10,10,10,10,10,10,10,10,10,10,10,10,10,10,10,10,10,10,10,10,20,20,10,10,10,10,10,10,10,10,20,10,10,10,10,20,10,10,10,10,10,10,10,10,20,10,10,10,10,10,10,10,10,10,10,10,10,10,10,10,10,10,10,10,10,30,10,10,10,10,20,40,10,10,10,10,10,10,10,30,10,10,10,10,10,10,10,10,20,10,10,10,10,10,10,10,10,10,10,10,10,10,10,20,10,10,10,10,10,10,10,10,10,10,10,10,10,10,10,10,10,10,10,20,10,10,10,10,10,10,10,20,10,10,10,10,10,10,10,10,20,10,20,10,10,10,10,10,10,50,10,10,10,10,60,10,10,10,10,10,40,10,10,10,10,10,20,10,20,10,10,10,10,30,10,10,10,10,10,10,10,10,20,10,10,10,10,10,10,10,10,30,10,10,10,10,10,10,10,30,10,10,10,10,10,10,10,10,10,10,10,10,10,10,10,10,10,10,30,10,10,10,10,10,10,10,40,10,10,10,10,10,10,40,10,10,10,10,10,10,40,10,10,10,10,10,50,10,10,10,10,50,10,10,10,10,10,40,10,10,10,10,10,10,10,30,10,10,10,10,10,10,40,10,10,10,10,10,10,10,30,10,10,10,10,10,10,10,20,20,10,10,10,10,10,10,10,20,10,10,10,10,10,10,10,40,10,10,10,10,10,10,40,10,10,10,10,10,40,10,10,10,10,10,10,30,10,10,10,10,10,10,40,10,10,10,10,10,10,10,30,10,10,10,10,10,10,10,10,20,10,10,10,10,10,10,10,10,10,10,10,10,10,10,10,10,10,10,10,10,10,10,10,10,10,10,10,10,10,10,10,10,10,10,10,10,10,10,10,10,10,10,10,10,10,10,10,10,10,20,10,10,10,10,10,10,10,20,10,10,10,10,10,10,10,20,10,10,10,10,10,10,10,30,10,10,10,10,10,10,10,10,10,10,10,10,10,10,10,10,10,10,10,10,10,10,10,10,10,10,10,10,10,10,10,10,10,10,10,10,10,10,10,10,10,10,10,10,10,10,10,10,10,10,10,10,10,10,10,10,10,10,10,10,10,10,10,10,10,10,10,40,10,10,10,10,10,10,10,10,10,10,10,10,10,10,10,10,10,10,10,10,10,10,10,10,10,20,20,10,10,10,10,10,10,40,10,10,10,10,10,20,10,10,10,10,10,10,10,10,10,30,10,10,10,10,10,10,10,10,20,10,10,10,10,10,10,10,20,20,10,10,10,10,10,20,20,10,10,10,10,10,10,10,10,30,10,10,10,10,10,10,10,10,10,10,10,10,10,10,10,10,10,10,10,10,10,10,10,10,10,10,30,10,10,10,10,10,10,40,10,10,10,10,10,10,40,10,10,10,10,10,50,10,10,10,10,10,10,40,10,10,10,10,60,10,10,10,10,60,10,10,10,10,10,10,40,10,10,10,10,10,10,10,10,20,10,10,10,10,10,10,10,30,10,10,10,10,10,10,40,10,10,10,10,10,10,40,10,10,10,10,10,50,10,10,10,10,70,10,10,10|-73,-90,70,38,76,12,-269,-89,-47,-77,-43,-161,114,-83,-48,36,-18,-11,-2,-39,-239,-140,-40,-341,-106,-78,83,92,62,-34,-231,-381,-311,-15,-178,-49,-29,-29,-73,-44,-271,-2,-49,-102,-126,-65,-45,-51,-71,-75,-21,52,-19,-29,-24,-131,38,-79,-53,-8,271,43,-24,-60,-8,-8,-5,-15,8,21,-127,72,-16,-40,-43,-70,64,232,-28,172,-22,-27,-8,-100,-134,99,133,61,67,-37,-1,-7,-55,-75,108,-112,7,-70,469,-62,-12,116,-54,-259,-49,-150,-146,-58,-3,-5,-66,-45,-102,-17,-22,-71,-96,-27,0,-46,30,-22,-130,-233,-89,-189,-14,111,0,-9,12,-235,-178,-6,-9,27,-31,-70,-7,-7,-13,-71,27,-1,-14,-24,-101,-38,18,50,-79,-3,-191,-47,-2,-12,-12,112,24,-5,-93,-295,-80,0,-8,-1,115,112,200,235,114,67,-13,-37,-130,-96,85,71,232,141,-265,-137,-57,-8,81,391,-37,-68,-76,57,119,-240,-45,-102,53,40,-23,61,-71,-156,-26,-19,81,-123,-83,-59,104,0,-96,-7,-17,-34,-18,-11,0,-98,-52,-84,-8,-53,-11,48,-4,-34,-16,-143,-7,-31,-77,-44,-34,-15,-64,-65,-21,-152,-240,-26,-172,-50,-170,-32,-33,-1,-25,-15,-15,-91,-87,-231,-19,-34,-70,-59,55,17,-24,10,-29,-41,-2,-56,27,-134,-54,-41,-30,46,-3,-363,-20,-55,65,16,38,9,-79,-9,51,83,-97,-36,62,-5,-28,-73,-12,0,62,-198,-4,-20,-4,-17,-128,-34,68,-31,-247,-239,-21,-41,-93,-24,14,-81,-238,-165,-44,-40,-102,2,-99,661,-188,0,0,-9,-27,-20,27,33,639,-2,-20,-55,-99,-45,-31,-423,-152,-66,-30,-3,-86,-36,104,-45,-34,104,-227,-191,-80,-65,-56,-86,143,-26,-21,-80,-47,-23,73,165,-93,-7,-43,-9,70,123,-50,-5,-1,57,63,-36,-17,-62,-39,-14,-34,-5,-77,-37,-98,-45,-59,-49,4,-159,-74,-29,-16,-244,-486,-245,8,-13,-1,-34,-58,-182,-62,-695,372,44,-46,-5,-11,-156,-178,-64,-2,-67,-37,-24,-61,-57,-30,69,-27,-153,7,-19,-19,-78,-52,-31,231,-54,-18,-28,-40,51,117,117,-14,-84,-23,-38,134,197,-10,-51,-2,-71,-49,26,268,-15,-83,-49,-35,-29,-94,29,-39,-140,-167,-68,-1,-31,-120,0,74,-59,-116,-134,-37,-136,-154,-136,-303,6,44,-29,-32,-48,-7,-115,-667,-500,-242,0,-1,-30,-3,-21,119,-115,-565,-211,115,-9,-67,-84,-13,-68,-93,-80,-106,65,-8,-89,-417,-29,-27,-61,-27,-18,64,66,115,22,-57,-55,-1,-10,-18,-80,112,85,47,-28,-3,-75,-20,-69,-54,252,90,-63,-35,-12,-4,-15,-1,11,68,-23,-16,-95,-3,-3,-25,31,7,-101,-104,-63,-45,-91,-6,81,-6,-110,-70,49,-13,-85,-57,-179,-66,-92,-284,-152,-249,-80,45,-75,-158,-50,-115,-9,-22,-322,-124,-57,-64,-1,-100,-58,-104,-67,-106,-224,-45,287,-21,-314,-18,-50,-60,-19,-50,-74,-32,339,-8,-114,-164,-31,-16,-6,-37,-26,82,40,40,-13,-30,-75,-54,-124,-2,-37,-10,19,-67,-62,-307,-130,-153,44,-18,-15,-2,-5,-31,10,-11,-78,50,74,-1,-15,-35,-9,-29,-31,91,58,-45,-48,-14,-8,-123,-205,-7,-3,-15,-63,-17,-26,-48,-106,-153,-166,-7,-23,-116,-53,-50,-23,-6,-10,-22,3,-142,-251,-196,-80,-30,-21,75,-36,-6,-188,-28,-2,8,-6,-72,-40,-5,-49,-28,-4,-101,-12,49,33,-19,-96,-169,-58,-293,-201,-69,-25,-82,-17,0,-10,-149,-134,-41,-87,-12,-29,-10,-34,-30,35,59,-122,-5,9,24,0,-13,47,81,-47,104,-7,-17,-76,-34,-17,-49,-69,-47,-20,-26,-46,-49,-248,-35,51,-29,-15,-14,-9,-285,-46,-1,-51,-56,-45,-139,-17,-45,-22,-16,-35,-75,-5,-13,0,-5,-18,-13,2,-7,-10,89,-1,-3,-148,-16,-51,-5,-9,-10,33,37,-44,-125,-1,-7,-48,-20,-10,-1,61,65,100,43,-15,-6,-68,-9,-92,-47,-38,-47,-17,215,500,1000,45,-41,-45,-26,-91,73,24,-28,-27,-65,-102,-27,-96,-142,-34
VANTAGE:SP500 :
SP500|20121220|20221220|0.573,-0.033,0.0,-0.041,0.0,0.846,-0.045,0.0,-0.026,0.0|1.45,0.109,0.0,-0.119,0.0,-0.626,-0.007,0.0,-0.08,0.0|-0.06,0.475,0.0,0.142,0.0,0.089,0.612,0.0,0.13,0.0|0.214,-0.127,0.0,0.619,0.0,-0.057,-0.084,0.0,0.556,0.0|0,10,10,10,10,10,10,10,10,10,10,10,10,10,10,10,10,10,10,10,10,10,10,10,10,10,10,10,10,10,10,10,10,10,20,10,10,10,10,10,10,40,10,10,10,10,10,70,10,10,10,10,60,10,10,10,20,50,10,10,10,70,10,10,10,10,10,20,10,10,10,10,10,10,10,10,10,10,10,10,10,10,10,10,10,10,10,10,10,10,10,10,10,10,10,10,10,10,10,10,10,10,10,10,10,10,10,10,10,10,10,10,10,10,10,10,10,20,10,10,10,10,10,10,10,40,10,10,10,10,10,10,40,10,10,10,10,10,10,30,10,10,10,10,30,20,10,10,10,10,10,10,20,10,10,10,10,10,10,10,10,10,10,10,10,10,10,10,10,10,10,20,10,10,10,10,10,10,10,10,20,40,10,10,10,20,20,20,10,10,10,10,20,30,10,10,10,10,10,10,10,10,10,20,10,10,10,10,20,10,10,20,10,10,10,10,20,10,10,10,10,10,10,10,10,20,10,10,10,10,10,10,10,10,20,10,10,10,10,10,10,10,10,30,20,10,10,10,10,10,10,50,10,10,10,10,60,10,10,10,10,60,10,10,10,10,50,10,10,10,10,30,10,10,10,10,10,10,10,30,10,10,10,10,10,10,50,10,10,10,10,10,10,20,10,10,10,10,10,10,10,10,10,10,10,10,10,10,10,10,10,10,10,10,20,10,10,10,10,10,10,10,50,10,10,10,10,10,10,40,10,10,10,10,10,10,30,10,10,10,10,10,10,40,10,10,10,10,10,40,10,10,10,10,10,10,30,10,10,10,10,10,10,10,10,10,10,10,10,10,10,10,10,10,10,10,10,10,10,10,10,10,20,10,10,10,10,10,10,10,10,10,10,10,10,20,10,10,10,10,10,10,10,10,30,10,10,10,10,10,10,40,10,10,10,10,10,10,30,10,10,10,10,10,10,10,30,10,10,10,10,10,10,40,10,10,10,10,10,10,30,10,10,10,10,10,10,10,20,10,10,10,10,10,10,10,10,10,10,10,10,10,10,10,10,10,10,10,10,10,10,10,10,10,10,10,10,10,10,10,10,10,10,10,10,10,10,10,10,20,10,10,10,10,10,20,20,10,10,10,10,10,10,10,10,10,10,10,10,10,10,10,10,20,10,10,10,10,10,10,10,10,40,10,10,10,10,10,40,10,10,10,10,10,10,30,10,10,10,10,10,10,10,10,10,10,10,10,10,10,10,10,10,10,10,10,10,10,10,10,10,10,10,10,10,20,10,10,10,10,10,10,10,20,10,10,10,10,10,10,10,30,10,10,10,10,10,10,10,10,10,10,10,10,10,10,10,10,10,10,10,10,10,10,10,10,10,10,10,10,10,10,10,10,10,10,10,10,10,40,10,10,10,10,10,40,10,10,10,10,10,10,10,30,10,10,10,10,10,10,10,20,20,10,10,10,10,10,10,10,20,10,10,10,10,10,20,30,10,10,10,10,10,10,10,30,10,10,10,10,10,10,10,10,10,10,10,10,10,10,10,10,10,10,10,10,10,10,10,10,10,10,10,10,10,10,10,10,10,10,10,10,10,10,10,10,10,10,10,10,10,10,40,10,10,10,10,10,10,40,10,10,10,10,10,60,10,10,10,10,10,10,30,10,10,10,10,10,50,10,10,10,10,10,10,40,10,10,10,10,10,10,10,30,10,10,10,10,10,10,10,10,10,10,10,10,10,10,10,10,10,10,10,10,10,10,10,10,10,10,10,30,10,10,10,10,10,50,10,10,10,10,10,50,10,10,10,10,70,20,10,10|-94,-209,311,137,89,-128,-228,-15,79,-81,-631,743,252,116,128,-196,-100,-101,-6,207,237,724,345,190,118,-290,-17,-163,-33,-37,140,425,736,-17,-22,-61,-5,-20,85,150,-15,102,274,179,4,-58,-30,-161,-71,-17,-31,-44,-107,53,-3,-19,7,93,-153,-32,-3,-46,-16,-9,71,-131,396,-13,34,-83,-15,-11,-17,72,-457,-143,-67,63,-207,-155,-223,-48,-762,266,-66,339,503,-54,-303,-173,-45,-58,-5,-52,624,1000,496,85,-173,-51,-58,-71,46,92,127,-32,-70,-1,-45,-63,-84,-102,-79,-117,-1,-114,-39,52,-12,-18,-13,-2,192,153,190,-120,-147,-13,-75,-9,-54,-31,-7,-128,-39,-97,60,-29,-24,-23,-173,-133,-241,-118,22,-2,1,-2,-48,-12,-23,-89,-23,-37,-33,-10,-5,-60,-28,-80,-113,-128,184,-170,-93,-50,-7,-43,-52,-87,-143,37,-100,-39,-239,-24,-154,82,-27,100,766,-51,-23,168,-29,138,-35,-50,42,71,-23,38,-23,57,131,-16,-35,-12,-54,-15,181,128,127,131,-19,-47,-108,-43,84,-152,-5,-7,-10,-8,-20,59,53,-269,-44,-7,-67,-26,-13,-10,-116,-21,-49,87,-19,-8,-31,-35,-38,-13,170,185,-54,-4,-56,-85,-108,-147,-19,-15,76,-9,-59,-100,-36,-39,-31,-18,141,66,-85,-27,44,123,123,-13,-8,36,-13,-39,-13,8,189,82,-17,-33,-5,146,-100,-29,64,-20,-53,-23,-97,-2,-77,-89,-5,-21,-132,-31,-15,-47,-1,-8,32,-13,-39,-42,-27,-43,12,-97,-35,-29,-18,-32,152,41,-13,-39,-14,-13,-36,-10,-37,-25,49,109,97,118,85,-56,-59,-74,-21,-167,-145,-12,-5,-29,-63,-107,202,-15,-33,-46,-63,-89,-97,-56,17,-25,-74,-2,-101,-210,-127,-96,-15,-59,-105,-24,-106,-37,-52,-2,-25,-27,-47,-5,14,-8,51,-6,-32,-5,23,-57,-32,-17,39,-4,-20,-28,-42,-23,101,-8,-11,-30,-25,-165,-113,-53,-82,-4,-52,-3,-5,21,-22,-333,-3,94,25,-33,-14,-83,26,-26,-41,-43,-36,63,9,-343,-304,-231,-15,-54,44,-127,-182,139,-83,25,-30,-14,-36,-32,-84,-138,23,-49,-13,-17,-139,-168,-146,-2,-46,-54,-34,-17,-40,-132,-149,-79,-40,-116,-65,-50,-124,-69,37,-21,-29,-6,-48,-232,-84,-59,-3,-6,-13,-11,1,-6,-133,-252,-12,-44,-114,-25,-120,-24,128,-27,-166,-36,-47,-65,-43,-15,-3,-88,-170,-209,-58,-185,-101,-120,-106,65,-21,-40,-12,87,-104,-31,-333,-272,-177,43,-75,-89,-41,-65,-52,-29,3,-10,-44,-18,-11,-7,-46,-37,-7,-5,27,-19,-8,-55,85,54,-6,-141,19,-19,-19,-6,-55,1,-36,-148,-22,-66,-107,-13,-197,-36,39,117,94,31,-20,94,238,48,-18,-41,-9,-1,-24,-30,9,-6,232,-16,-16,79,-27,13,-15,-15,194,223,344,212,-33,13,49,136,-5,-7,227,-82,-42,155,65,86,-24,71,-38,-38,-10,-209,17,0,-41,-19,-87,-36,-18,-108,69,-38,-11,-25,-31,70,-10,135,62,-133,85,-1,-10,-14,-97,82,-5,-16,-81,-390,-83,-1,-35,-27,-115,-92,-4,130,145,-337,0,-1,-59,-32,-120,169,14,-34,25,-14,-30,7,-24,59,-5,35,-8,-11,-11,155,179,100,80,17,-6,-5,-46,-1,566,396,41,-13,-63,-10,53,60,253,820,325,202,-120,-23,18,-136,-42,6,-85,-26,-54,-60,0,14,-26,144,-24,-84,-12,-37,-37,25,134,157,-3,181,-23,-64,34,-10,53,-122,126,173,277,-323,-76,11,-8,-31,0,-5,156,-40,202,47,-33,22,-88,-127,-89,-171,-4,186,213,-24,-1,0,-17,-34,80,155,-53,-51,-113,-57,-36,-2,73,24,65,36,-21,191,-12,-42,-13,-16,-18,-13,90,541,125,-39,-1,-398,-43,-65,-496,-1,-11,-35,-21,-4,-68,-56,-78,66,-19,-51,51,39,330,-34,-173,11,18,-7,-24,-51,400,-19,173,-54,-208,-48,-29,-184,-34,-234,-26,178,178,-2,-63,-54,-71,-58,-91,-154,69,-40,-59,-136,-55,-122,-3,-18,-27,-203,-33,15,84,-10,-13,82,-93,317,0,215,80,37|0,10,10,10,10,10,10,10,10,10,10,10,10,10,10,10,10,10,10,10,10,10,10,10,10,10,10,10,10,10,10,10,10,10,20,10,10,10,10,10,10,50,10,10,10,10,10,60,10,10,10,10,60,10,10,10,20,50,10,10,10,70,10,10,10,10,10,20,10,10,10,10,10,10,10,10,10,10,10,10,10,10,10,10,10,10,10,10,10,10,10,10,10,10,10,10,10,10,10,10,10,10,10,10,10,10,10,10,10,10,10,10,10,10,10,10,30,10,10,10,10,10,10,10,40,10,10,10,10,10,10,40,10,10,10,20,10,30,10,10,10,10,30,20,10,10,10,10,10,10,20,10,10,10,10,10,10,10,10,10,10,10,10,10,10,10,10,10,10,20,10,10,10,10,10,10,10,10,20,10,30,10,10,10,20,50,10,10,10,20,10,30,10,10,10,10,10,10,10,30,10,10,10,10,20,10,10,20,10,10,10,30,10,10,10,10,10,10,10,10,30,10,10,10,10,10,10,10,20,10,10,10,10,10,10,10,10,30,20,10,10,10,10,10,10,50,10,10,10,10,60,10,10,10,10,60,10,10,10,10,50,10,10,10,10,30,10,10,10,10,10,10,10,30,10,10,10,10,10,10,40,10,10,10,10,10,10,10,20,10,10,10,10,10,10,10,10,10,10,10,10,10,10,10,10,10,10,10,10,20,10,10,10,10,10,10,10,10,40,10,10,10,10,10,10,40,10,10,10,10,10,10,30,10,10,10,10,10,10,40,10,10,10,10,10,40,10,10,10,10,10,10,30,10,10,10,10,10,10,10,10,10,10,10,10,10,10,10,10,10,20,10,10,10,10,10,10,20,10,10,10,10,10,10,10,10,10,10,10,10,10,10,10,10,10,10,10,10,10,10,30,10,10,10,10,10,10,40,10,10,10,10,10,10,30,10,10,10,10,10,10,10,20,10,10,10,10,10,10,10,40,10,10,10,10,10,10,30,10,10,10,10,10,10,10,20,10,10,10,10,10,10,10,10,10,10,10,10,10,10,10,10,10,10,10,10,10,10,10,10,10,10,10,10,10,10,10,10,10,10,10,10,10,10,10,10,20,10,10,10,10,10,20,20,10,10,10,10,10,10,10,10,10,10,10,10,10,10,10,10,20,20,10,10,10,10,10,10,40,10,10,10,10,20,30,10,10,10,10,10,10,40,10,10,10,10,10,10,10,10,10,10,10,10,10,10,10,10,10,10,20,10,10,10,10,10,10,10,10,20,10,10,10,10,10,10,30,10,10,10,10,10,10,10,10,10,10,10,10,10,10,10,10,10,10,10,10,10,10,10,10,10,10,10,10,10,10,10,10,10,10,10,10,10,10,20,10,10,10,10,10,10,50,10,10,10,10,10,40,10,10,10,10,10,10,10,10,20,10,10,10,10,10,10,10,20,20,10,10,10,10,10,10,10,20,10,10,10,10,10,10,10,30,10,10,10,10,10,10,10,40,10,10,10,10,10,10,10,10,10,10,10,10,10,10,10,10,10,10,10,10,10,10,10,10,10,10,10,10,10,10,10,10,10,10,10,10,10,10,10,10,10,10,10,10,50,10,10,10,10,10,10,40,10,10,10,10,10,60,10,10,10,10,10,10,30,10,10,10,10,10,50,10,10,10,10,10,50,10,10,10,10,10,10,10,30,10,10,10,10,10,10,10,10,10,10,10,10,10,10,10,10,10,10,20,10,10,10,10,10,10,40,10,10,10,10,10,50,10,10,10,10,10,50,10,10,10,10,10,60,20,10,10|-506,-65,-264,-239,-206,-1,45,-58,-192,-202,-134,-214,-304,-117,-129,-70,-148,-46,-2,-77,-253,-532,-138,-73,-6,-23,-6,-50,-94,-286,-213,-271,-190,107,150,-25,-46,-49,-121,-52,-166,-98,-54,-58,-100,-18,206,265,-58,-6,-137,163,-26,-152,-24,-52,3,-80,-71,-4,-20,-51,-42,-74,-111,93,-81,70,47,-51,-5,-93,-74,-139,-119,-11,-51,-17,438,252,-95,-52,-194,-175,-78,-285,-129,-310,-82,-75,-199,-36,-142,-186,-328,-371,-157,-57,175,0,-4,-142,-150,-36,-175,-22,-101,66,69,298,-39,-18,-37,100,-38,226,-50,-74,0,-58,-86,-80,-1,-104,153,62,-67,0,81,212,4,134,74,-121,-100,83,-2,94,-43,-36,-8,-27,2,-56,-8,-85,-35,-2,23,108,-15,452,-28,-15,-15,-60,-64,180,-98,64,-26,719,19,-91,-67,-149,-14,206,131,-201,276,319,185,-46,-176,-259,-57,-213,-149,-57,-96,-79,133,123,-13,-79,-164,-38,-68,69,-10,-19,-17,93,-20,-9,-61,-2,-19,-63,-164,-182,-16,-35,-115,-52,-4,-6,-28,-19,-162,-58,140,-30,26,49,-47,-78,-2,343,274,62,-61,-190,-1,-105,-98,-112,246,-98,-103,-165,-282,-5,-2,-142,-133,-41,-48,-23,-84,-250,-22,114,286,-22,-217,-149,-47,-135,-255,-26,-42,246,267,-130,-1,-32,-14,-50,-322,-62,-20,-135,-38,-51,-46,86,-23,-110,-155,-49,-9,14,-22,-23,135,-96,-51,-132,87,175,139,-14,-51,-53,-38,132,149,47,-97,-86,-65,-26,-70,-48,-11,-76,35,-149,-343,-163,-101,35,-4,-32,-3,-229,-102,-353,-94,-59,-157,-86,-22,-129,190,137,-79,-41,-136,-26,-10,-97,107,1,-56,-37,-35,-23,84,78,0,-9,75,-40,-41,-53,-23,80,88,-75,-114,-10,80,-21,-151,-67,-29,-87,-71,-42,-12,-67,-93,-47,-165,-98,-8,219,216,109,-9,-48,-161,-55,-83,9,-15,220,142,119,-24,-76,-97,-3,-57,-6,39,-7,-118,-186,-60,-10,-82,-50,-204,-47,-185,40,20,-83,-54,-9,55,-177,-18,289,568,228,15,-119,-172,-90,-35,-70,16,-51,-116,-43,-109,-32,-20,-14,-13,-142,-26,-36,-43,-81,-91,98,-27,155,130,-6,-26,-52,147,128,0,-74,-20,-149,-41,303,508,-21,-45,66,-130,-53,-69,657,105,104,-85,-95,-27,-8,-125,-268,312,-72,223,-78,-11,-79,-208,-147,-61,-505,-5,-4,-1,-10,-175,-259,-142,-178,-11,-102,72,83,306,-1,-5,-9,-72,-57,-5,-13,-119,239,776,567,46,-5,-53,-79,-25,-71,-24,93,-35,-10,-29,-160,-36,13,195,-34,80,-41,-2,-86,-116,-49,-1,-98,-52,-18,-36,-82,92,25,-3,158,-47,-56,-16,-61,118,450,-44,-132,-21,-28,-212,-202,-66,-25,-116,-228,-2,-140,-394,-10,-230,-120,32,-134,-140,-199,-99,-29,-437,-68,-32,-89,-134,-3,-28,-38,-3,-3,-521,-50,-66,-66,-24,-63,-74,-110,-80,-23,-4,-7,-21,-7,-73,-138,-29,-240,-109,-69,-77,-91,-10,-6,-26,-134,-82,-79,-92,-52,-112,69,-74,-89,-40,-8,-164,-271,-192,-45,110,246,-33,-83,-2,-59,-75,-9,-157,671,-43,-2,-9,39,-164,-85,-59,-84,-72,-83,-195,-180,36,-42,-37,-73,-58,-214,-78,-93,146,-27,-49,-5,-97,-31,-5,109,-111,-28,-36,-41,-90,-45,-123,-279,-338,-11,-150,-5,-72,-44,-7,-99,12,-279,-61,70,-173,-12,-45,-30,-19,-168,14,-231,-149,-58,-36,-84,-250,-160,-111,-28,-38,-129,-27,-116,-26,-409,-240,-89,-135,-64,-87,-95,-9,-65,-3,-7,-97,-203,-165,-52,-59,-41,-18,-7,-56,254,-44,-71,-40,207,-9,-41,-7,-85,-243,-18,-13,-67,-17,-41,-57,-1,-20,-20,-105,-120,-51,-29,-117,-72,-30,-44,-52,-33,-29,-172,-5,-28,-114,176,-14,-24,-137,-3,-157,18,-4,-194,-55,-159,-100,-195,-148,-60,-221,-46,-65,-5,-96,-10,-23,-17,-264,-79,-72,-70,-9,-45,-19,-15,196,262,-6,-207,17,-29,210,209,816,1000,84,-169,-112,-34,-3,-207,-92,-29,-61,0,209,-223,-91,-13,-5,-154,-124,-200,-64,22,-59,-58,-37
BINANCE:BTCUSD
BTCUSD|20121220|20221220|0.475,0.011,0.0,-0.003,0.0,0.881,0.013,0.0,-0.001,0.0|1.25,0.06,0.0,-0.022,0.0,-0.475,0.024,0.0,0.01,0.0|-0.077,0.46,0.0,0.231,0.0,0.015,0.566,0.0,0.169,0.0|0.034,-0.184,0.0,0.618,0.0,-0.004,-0.174,0.0,0.73,0.0|0,10,10,10,10,10,10,10,10,10,10,10,10,10,10,10,10,10,10,10,10,10,10,10,10,10,10,10,20,10,10,10,10,10,10,10,10,20,10,10,10,10,10,10,10,10,10,10,10,10,10,10,10,10,10,10,10,10,10,10,10,10,10,20,20,10,10,10,90,50,120,20,10,30,20,10,10,10,10,10,10,10,10,10,10,10,10,10,10,10,10,10,10,10,10,10,10,10,10,10,10,10,10,10,10,20,10,10,10,10,10,10,10,10,10,10,10,10,10,10,10,10,10,10,10,10,10,10,10,10,10,10,10,10,20,10,10,10,10,10,20,10,20,10,10,10,10,10,10,10,10,10,40,20,10,10,10,10,10,20,10,10,10,10,10,10,10,10,10,10,10,30,20,10,10,10,10,10,40,10,10,10,10,10,10,20,20,10,10,20,10,10,10,10,10,50,10,10,10,10,10,10,10,20,10,10,10,10,10,10,10,10,20,10,10,10,10,10,10,10,10,10,10,10,10,10,10,10,10,10,10,10,10,10,20,10,10,10,10,10,10,10,10,10,10,10,10,10,10,10,10,10,10,10,10,10,10,20,10,10,10,10,10,10,40,10,10,20,10,60,10,10,10,10,10,10,10,30,10,10,20,30,10,10,20,30,10,20,10,10,10,10,20,10,10,10,10,10,10,10,10,10,10,10,10,10,10,10,10,10,10,10,10,20,20,10,10,10,10,10,10,10,10,10,10,10,10,10,10,10,10,10,10,50,10,10,10,10,10,50,10,20,10,10,60,10,10,10,10,20,10,20,10,10,10,10,10,20,10,10,20,10,10,10,10,10,10,10,20,10,10,10,10,10,10,10,10,10,10,10,10,10,10,10,10,10,10,10,10,10,10,10,10,10,10,10,10,10,10,10,10,10,10,10,10,10,10,10,10,10,10,10,10,10,10,20,10,10,10,10,10,10,50,10,10,30,60,10,20,10,10,10,30,10,10,10,10,10,10,10,20,10,10,10,10,10,10,10,10,10,10,10,10,10,10,10,10,10,10,10,10,10,10,10,10,10,10,10,10,10,10,10,10,10,10,10,20,10,10,10,10,10,10,10,10,10,20,10,10,10,20,10,10,10,10,40,10,10,10,10,10,10,30,10,10,10,10,10,10,10,10,30,10,10,10,10,10,10,10,10,10,10,10,10,10,10,10,10,10,10,20,10,10,10,10,10,10,10,10,10,20,20,10,10,10,10,10,10,10,10,10,10,10,10,10,10,10,10,10,10,10,10,10,10,20,10,10,10,10,10,10,10,10,10,10,10,10,20,10,10,10,10,10,10,20,10,10,10,10,10,10,10,30,10,10,10,10,10,10,10,10,20,10,10,10,10,10,10,10,10,10,10,10,10,10,10,10,10,10,10,10,10,10,10,10,10,10,10,10,10,10,10,10,30,10,10,10,10,10,10,30,10,10,10,10,10,10,10,20,10,10,10,10,10,20,10,20,10,10,10,10,10,10,10,10,10,20,10,10,10,10,10,10,10,10,10,10,10,10,10,10,10,10,10,10,10,10,10,10,10,10,10,20,10,10,10,10,20,10,10,10,10,10,10,10,10,10,10,10,10,10,10,10,10,10,10,10,10,10,10,10,10,10,30,20,10,10,10,10,10,10,10,10,10,10,10,10,10,10,20,10,10,10,10,10,10,10,20,10,10,10,10,10,10,10,10,10,10,20,10,10,10,10,10,10,10,10,20,10,20,10,10,10,10,10,10,10,10,10,10,10,10,10,10,10,10,10,10,20,10,10,10,10,10,10,10,10,20,10,10,10,10,10,10,10,10,10,10,10,10,10,10,10,10,10,10,10,10,10,10,10,10,10,10,10,10,10,10,10,10,10,10,10,10,10,10,10,10,10,10,10,10,10,10,10,10,10,10|48,-117,85,77,-23,-43,-130,-18,-95,-108,-79,-29,-6,-14,-71,-12,-20,-101,-109,-202,-33,39,-52,-66,-249,-74,-47,-266,-10,-27,-9,-1,-15,-17,-4,-63,-115,-37,36,-4,-10,-32,-29,-15,-62,-219,-132,-6,-9,-76,-35,-47,-82,-36,-82,-117,-33,-1,-6,23,108,-52,-84,-3,-285,18,186,378,124,-135,79,-172,21,299,-34,-16,-3,-53,-209,-10,-14,85,-4,-105,-14,-101,-159,-319,-67,69,45,-18,-63,-202,-30,-142,-504,-125,14,74,-2,-6,-13,1,-8,-187,-8,-9,-5,-66,-102,12,-49,77,-58,-238,-41,-7,0,-117,-6,-53,-60,-32,-81,-414,-426,-139,-11,-139,-48,38,-7,170,-515,-442,-24,89,134,-21,-11,-155,102,-121,13,70,-10,-138,-62,-148,-323,-72,-4,-67,384,-183,-75,-18,51,52,0,11,97,1000,184,-6,18,-93,69,-25,42,267,-76,-45,-226,-81,57,20,22,-50,8,-113,-11,-6,79,-11,28,27,87,-14,5,23,-2,3,-2,145,84,66,-32,-42,52,-60,36,-18,-34,-107,63,-198,-551,-189,-3,227,28,-127,-4,-41,127,-176,-1,-95,35,27,152,42,42,43,41,-73,13,-108,-140,-24,60,40,-5,-20,-79,-230,-245,-5,-26,-6,36,33,-1,15,-23,-31,-193,21,-15,24,30,43,-14,26,-11,121,139,199,-53,-31,14,74,77,112,268,-63,2,156,308,76,17,0,14,4,0,11,343,-36,14,-87,-171,-2,41,-75,-33,-646,-1298,-725,32,37,-232,-119,-353,-25,-9,-401,-4,12,45,111,53,-83,-118,-81,-52,-5,-18,-16,21,43,50,105,-26,0,-19,-67,-9,47,-2,0,-3,10,-3,-2,-21,-19,-1,12,-8,8,33,54,64,19,-33,-27,-86,-85,44,46,-11,59,75,0,12,-2,-1,5,-2,186,69,-21,-8,-22,73,5,7,0,128,-6,-90,44,-28,34,-388,-235,89,40,-138,-378,-147,-76,51,65,222,-5,53,51,68,-53,58,-63,-5,-11,-5,-7,10,4,63,137,40,234,141,-18,-9,-5,-73,-46,36,44,21,23,-4,-33,-9,0,-27,-1,-4,5,-140,-7,-2,-4,0,-8,92,-1,-48,-26,-70,-78,-78,11,-63,0,-4,0,48,48,-1,72,281,-4,-1,-1,76,143,18,167,57,40,-8,-11,-7,-5,69,63,84,415,64,45,-109,-40,-27,-16,65,63,-49,66,53,56,56,-6,3,-7,-6,-8,35,44,56,-2,54,65,180,0,61,42,43,-24,-18,81,43,-12,10,32,-3,6,39,37,-35,-164,-68,-25,97,96,69,-6,-99,-7,-3,-6,-158,66,37,74,-70,32,59,-94,-136,-65,-60,-11,-2,58,63,53,-16,-3,-86,-43,-75,-4,52,64,70,68,-15,35,-28,-37,0,-3,10,-14,63,-5,21,-20,-74,-67,-86,-7,35,-13,-8,41,31,65,154,62,-11,-19,33,39,37,29,21,42,39,467,6,58,55,41,23,10,50,61,-29,7,7,-53,-78,21,11,56,-50,-56,-18,14,29,49,23,59,45,41,-31,-16,-2,32,-118,-27,51,15,-19,47,-1,94,-1,-155,-77,-26,-11,-20,39,51,-12,114,-10,-201,-164,-97,-36,-4,0,-35,45,-2,-27,-21,-34,-234,0,29,-8,-5,71,62,-41,-4,-30,-21,-10,-2,56,-23,14,-11,49,-25,6,60,71,71,22,-7,-4,-8,14,14,-317,-7,228,55,99,-92,-14,-8,-65,-368,-134,-76,33,55,-4,-12,-20,80,-46,2,104,57,185,140,-3,25,-22,-51,-18,-21,68,-53,22,140,125,-30,-1,81,-22,-20,-75,-42,-19,0,18,-1,-1,56,21,-22,-18,-41,48,0,29,-11,-6,-55,-18,-21,-41,-194,-99,56,129,-2,15,-1,-17,-47,-10,131,49,-30,-105,-116,-1,57,0,-3,-20,-17,62,68,-20,30,-5,-28,-91,-171,-74,-69,22,36,-19,61,-8,-110,-33,-77,-18,-205,-106,27,-25,62,-121,-150,-65,-6,72,72,57,5,36,0,-31,-17,145,-4,88,-30,75,85,39,38,-5,33,-5,-9,-2,-188,-48,29,32,-25,36,-2,-59,2,-9,11,-33,49,-15,-14,-31,-211,-122,-20,-12,-67,-32,-1,42,-8,-75,-43,-2,0,78,-14,17,-136,253,-31,-101,-380,-105,-1,42,23,-4,-46,-46,64,-7,-38,-22,37,44,37,-32,-43,-58,37,27,-7,-11,14,109,56,-13,-5|0,10,10,10,10,10,10,10,10,10,10,10,10,10,10,10,10,10,10,10,10,10,10,10,10,10,10,30,10,10,10,10,10,10,10,10,20,10,10,10,10,10,10,10,10,10,10,10,10,10,10,10,10,10,10,10,10,10,10,10,20,20,20,10,10,10,90,20,30,140,10,30,20,10,10,10,10,10,10,10,10,10,10,10,10,10,10,10,10,10,10,10,10,10,10,10,10,10,10,10,10,10,10,30,10,10,10,10,10,10,10,10,10,10,10,10,10,10,10,10,10,10,10,10,10,10,10,10,10,10,10,20,10,10,10,10,10,30,20,10,10,10,10,10,10,10,10,50,20,20,10,20,20,10,10,10,10,10,10,10,10,10,10,10,30,20,10,10,10,10,10,40,10,10,10,10,10,10,20,20,10,10,20,10,10,20,10,20,30,10,20,10,10,40,10,10,10,10,10,10,10,10,10,10,10,10,10,10,10,10,10,10,10,10,10,10,10,10,10,10,10,10,10,10,10,20,10,10,10,10,10,10,10,10,10,10,10,10,20,10,10,10,10,10,10,10,10,20,10,10,10,10,10,10,40,10,10,10,10,10,10,20,20,10,10,10,10,10,10,20,10,30,10,20,30,10,10,50,10,10,10,10,10,10,10,10,10,10,10,10,10,10,10,10,10,10,10,10,10,10,10,10,10,10,10,10,10,20,20,10,10,10,10,10,10,10,10,10,20,10,10,10,10,10,10,10,50,10,10,10,10,10,50,10,10,10,10,10,50,10,10,10,10,10,20,10,20,10,10,10,10,10,20,10,10,20,10,10,10,10,10,10,10,10,10,10,20,10,10,10,10,10,10,10,10,10,10,10,10,10,10,10,10,10,10,10,10,10,10,10,10,10,10,10,10,10,10,10,10,10,10,10,10,10,10,10,10,10,10,10,40,10,10,10,10,50,10,10,20,10,60,10,20,10,10,10,30,20,10,10,10,10,10,10,10,10,10,10,10,10,10,10,10,10,10,10,10,10,10,10,10,10,10,10,10,10,10,10,10,10,10,10,10,10,10,10,10,10,10,10,30,10,10,10,10,10,10,10,10,20,10,10,10,10,10,10,10,10,10,40,10,10,10,10,10,10,30,10,10,10,10,10,10,10,10,30,10,10,10,20,10,10,10,20,10,10,10,10,10,10,10,10,20,20,20,10,10,10,10,10,10,10,10,10,10,10,10,10,10,10,10,10,10,10,10,10,10,10,10,10,10,10,10,10,10,10,30,10,10,10,10,10,10,10,10,10,10,10,20,10,10,10,10,10,10,20,10,10,10,10,10,10,10,30,10,10,10,10,10,10,10,30,10,10,10,10,10,10,10,10,10,10,10,10,10,10,10,10,10,10,10,10,10,10,10,20,10,10,10,10,10,10,30,10,10,10,10,10,10,30,10,10,10,10,10,10,10,20,10,10,10,10,10,20,10,10,10,10,10,10,10,10,10,10,10,10,20,10,10,10,10,10,10,10,10,10,10,10,10,10,10,10,10,10,10,10,10,10,10,10,10,10,20,10,10,10,10,20,10,10,10,10,10,10,10,10,10,10,10,10,10,10,10,10,10,10,10,10,10,10,10,10,10,40,10,10,10,10,10,10,10,10,20,10,10,10,10,10,10,10,10,10,10,10,10,10,10,10,10,10,10,10,10,10,10,10,10,20,20,10,10,10,10,10,10,10,10,10,10,10,20,10,10,10,10,10,10,10,10,10,10,10,10,10,10,10,10,10,10,20,10,10,10,10,10,10,10,10,20,10,10,10,10,10,10,10,10,10,20,10,10,10,10,10,10,10,10,10,10,10,10,10,10,10,10,10,10,10,10,10,10,10,10,10,10,10,10,10,10,10,10,10,10,10,10,10,10,10|-97,-25,-103,-109,-104,-28,-6,167,37,-29,-123,-107,-11,-10,-21,-17,21,34,28,-2,-33,-7,44,95,83,109,64,-123,-118,-1,-13,55,2,-17,50,8,-34,-26,-24,-89,-17,-16,-24,55,38,29,-22,-14,-32,-12,-1,77,-3,44,47,-25,-29,-2,26,71,27,21,52,-108,-82,-86,-30,104,46,-39,-99,-64,-12,-179,63,47,-20,-49,-6,-28,-6,-3,-5,-4,17,59,-16,-16,-1,33,91,47,-10,25,96,59,-92,-62,-25,-6,44,-2,-6,-95,-18,-56,-12,-36,-42,-11,-12,36,40,-39,-44,0,173,58,-20,-4,22,49,62,77,-46,-14,-24,108,-10,-127,-8,66,-13,-42,-139,-82,-17,52,-125,0,-20,-23,76,97,57,44,50,50,65,51,78,11,-160,43,120,-50,-57,-10,17,50,-11,-124,-139,-42,-21,-53,29,30,-10,-97,-49,-3,-15,-7,79,1000,-5,-17,0,-9,-40,-24,40,-8,-14,-9,0,-21,-11,-12,173,105,-12,63,-10,52,-6,294,338,-14,-94,-65,-19,-50,-64,-6,-1,-97,329,30,-36,-25,-22,-112,-65,-65,-9,250,110,0,57,16,-56,-51,-9,25,185,-26,33,66,1,212,-44,-7,-20,67,50,-68,46,-23,36,34,5,-30,-84,81,-27,-31,-60,-4,-8,58,-23,-15,4,-34,-12,70,27,-58,10,-3,-5,-44,-2,28,-5,-2,-22,-6,-6,-3,42,-3,57,-3,3,66,351,16,187,48,-190,-104,-261,-132,-5,123,141,17,32,87,25,64,-51,-273,-135,57,-32,324,150,115,-4,-15,-168,-195,-63,-2,20,4,-65,4,-25,-170,-28,-30,15,-13,51,11,18,32,-14,-35,-144,-1,-60,-18,-79,-7,-76,19,-9,25,-52,0,-42,-10,-2,32,69,-16,-11,16,-8,-8,-1,-15,46,49,65,-1,-5,-9,-6,-16,41,43,-1,32,-22,-73,-3,0,-1,-63,-21,91,-59,-32,-37,-8,15,-9,-49,-209,-58,-47,-66,-60,-33,-12,-104,-1,-81,-31,-156,-2,-40,-6,-13,92,-3,-2,31,-118,-331,-166,-25,-32,44,120,-3,16,38,2,-48,-3,10,-7,36,-60,-25,-20,-19,68,39,39,24,-1,49,22,-20,33,-73,-98,5,-5,14,2,-12,-357,-40,-19,-3,0,-19,-6,20,-19,-138,-24,-158,-92,0,0,-28,-23,-13,-56,19,-21,-14,-43,22,-212,-104,-137,-74,-12,8,-13,-9,-109,-166,-293,-170,-54,-210,-99,-37,-98,-339,-215,-42,-3,-317,-450,-125,-77,-76,29,-4,-7,-45,-45,-95,63,106,-8,-51,-113,-107,-7,107,110,66,-168,101,-84,-21,-58,36,-34,-4,2,119,123,22,-2,-627,-75,-33,-14,79,28,0,-17,-111,-350,-234,-40,13,0,-6,-7,-373,-73,-99,-40,0,0,51,31,11,-29,-11,-11,-141,-40,31,-47,-12,-76,-22,-17,-58,-58,-196,-110,-186,-43,-30,-117,-17,12,-315,-148,-165,-11,-165,-287,-154,-20,0,-23,83,-90,-6,50,-190,-9,0,-3,-133,-101,-155,-71,-57,-57,-19,-4,143,-148,-226,-125,-22,-67,-52,-6,-109,16,-64,53,22,-72,-161,-116,-429,-126,-1,-20,-76,-5,41,22,-3,24,-111,-32,-86,31,-29,24,25,-7,-180,-142,-80,-294,-24,23,-2,-52,-34,-95,-29,-30,12,-6,71,-25,-5,-13,-11,-37,-14,-26,27,8,109,-1,127,38,-91,35,0,-24,-3,-3,-36,-21,0,124,-50,-183,0,-96,-7,-7,-10,-141,-256,-356,-322,-103,-2,-89,12,129,70,0,31,-45,-114,-48,-19,-88,-75,-2,-54,-1,8,69,38,-13,-61,-4,-63,55,34,-5,-11,0,-1,-14,6,-27,-76,-62,53,43,67,-4,48,-9,117,-36,-56,-17,-19,44,17,0,-19,-4,-6,-33,-6,63,278,-10,30,61,-1,-42,-5,-14,-3,-5,-1,-11,63,-2,-37,-128,-7,91,370,51,-12,-21,52,-2,-89,13,-21,129,26,52,55,-7,14,-62,-277,-196,-83,0,26,14,23,-11,-5,-64,-33,-20,-35,-1,-10,-13,-19,-9,-68,-17,-1,53,-9,45,-15,-11,-77,42,46,-6,-43,-28,-25,-21,-7,-14,31,41,33,-9,-20,338,594,182,-7,-2,12,27,2,90,-1,66,19,65,0,-44,40,8,77,67,-20,-13,23,42,8,-56,-25,-15,26,-79,-73,-201,-86,-8,-88,-113,-34,-32,64,-45,-9,-151,-7,17
OANDA:USDCAD :
USDCAD|20121220|20221220|0.503,-0.128,0.0,-0.383,0.0,1.0,-0.149,0.0,-0.22,0.0|1.151,0.499,0.0,-0.351,0.0,-0.492,0.163,0.0,-0.233,0.0|-0.723,0.493,0.0,-0.209,0.0,0.369,0.723,0.0,-0.206,0.0|0.373,0.141,0.0,0.498,0.0,0.214,0.334,0.0,0.23,0.0|0,10,10,10,10,10,10,10,10,10,10,10,10,10,10,10,10,10,10,10,10,10,10,10,10,10,10,10,10,10,10,10,10,10,10,10,10,10,10,10,10,10,10,10,10,10,10,10,10,10,10,10,10,10,10,10,10,10,10,10,10,10,10,10,10,10,10,10,10,10,10,10,10,10,10,10,10,10,10,10,10,20,10,10,10,10,10,10,10,10,20,10,10,10,10,10,10,10,10,10,10,20,10,10,10,10,10,10,10,10,10,10,10,10,10,10,10,10,10,10,10,10,10,10,10,10,10,10,10,10,10,10,10,10,10,10,10,10,10,10,10,10,10,10,10,10,10,10,10,10,10,10,10,10,10,10,10,10,10,10,10,10,10,10,10,10,10,10,10,10,10,10,10,10,10,10,10,10,10,10,10,10,10,10,10,10,10,10,10,10,10,10,10,10,10,10,10,10,10,10,10,10,10,10,10,10,10,10,10,10,10,10,10,10,10,10,10,10,10,10,10,10,10,20,10,10,10,10,10,10,10,10,10,10,10,10,10,10,10,10,10,10,10,10,10,10,10,10,10,10,10,10,10,10,10,10,10,10,10,10,10,10,10,10,10,10,10,10,10,10,10,10,10,10,10,10,10,10,10,10,10,10,10,10,10,10,10,10,10,10,10,10,10,10,10,10,10,10,10,10,10,10,10,10,10,10,10,10,20,10,10,10,10,10,10,10,10,10,10,10,10,10,10,10,10,10,10,10,10,10,10,10,10,10,10,10,10,10,10,10,10,10,10,10,10,10,10,10,10,10,10,10,10,10,10,10,10,10,10,10,10,10,10,10,10,10,10,10,10,10,10,10,10,10,10,10,10,10,10,10,10,10,10,10,10,10,10,10,10,10,10,10,10,10,10,10,10,10,10,10,10,10,10,10,10,10,10,10,10,10,10,10,10,10,10,10,10,10,10,10,10,10,10,10,10,10,10,10,10,10,10,10,10,10,10,10,10,10,10,10,10,10,10,10,10,10,10,10,10,10,10,10,10,10,10,10,10,10,10,10,10,10,10,10,10,10,10,10,10,10,10,10,10,10,10,10,10,10,10,10,10,10,10,20,10,10,10,10,10,10,10,10,10,10,10,10,10,10,10,10,10,10,10,10,10,10,20,10,10,10,10,10,10,10,10,10,10,10,10,10,10,10,10,10,10,10,10,10,10,10,10,10,10,10,10,10,10,10,10,10,10,10,10,10,10,10,10,10,10,10,10,10,10,10,10,10,10,10,10,10,10,10,10,10,10,10,10,10,10,10,10,10,10,10,10,10,10,10,10,10,10,20,10,10,10,10,10,10,10,10,10,10,10,10,20,10,10,10,10,10,10,10,10,10,10,10,10,10,10,10,10,10,10,10,10,10,10,10,10,10,10,10,10,10,10,10,10,10,10,10,10,10,10,10,10,10,10,10,10,10,10,10,10,10,10,10,10,10,10,10,10,10,10,10,10,10,10,10,10,10,10,10,10,10,10,10,10,10,10,10,10,10,10,10,10,10,10,10,10,20,10,10,10,10,10,10,10,10,10,10,10,10,10,10,10,10,10,10,10,10,10,10,10,10,10,10,10,10,10,10,10,10,10,10,10,10,10,10,10,10,10,10,10,10,10,10,10,10,10,10,10,10,10,10,10,10,10,10,10,10,10,10,10,10,10,10,10,10,10,10,10,10,10,10,10,10,10,10,10,10,10,10,10,10,10,10,10,10,10,10,10,10,10,10,10,10,10,10,10,10,10,10,10,10,10,10,10,10,10,10,10,10,10,10,10,10,10,10,10,10,10,10,10,10,10,10,10,10,10,10,10,10,10,10,10,10,10,10,10,10,10,10,10,10,10,10,10,10,10,10,10,10,10,10,10,10,10,10,10,10,10,10,10,10,10,10,10,10,10,10,10,10,10,10,10,10,10,10,10,10,10,10,10,10,10,10,10,10,10,10,10,10,10,10,10,10,10,10,10,10,10,10,10,10,10,10,10,10,10,10,10,10,10,10,10,10,10,10,10,10,10,10,10,10,10,10,10,10,10,10,10,10,10,10,10,10,10,10,10,10,10,10,10,10,10,10,10,10,10,10,10,10,10,10,10,10,10,10,10,10,10,10,10,10,10,10,10,10,10,10,10,10,10,10,10,10,10,10,10,10,10,10,10,10,10,10,10,10,10,10,10,10,10,10,10,10,10,10,10,10,10,10,10,10,10,10,20|53,-18,-312,-155,-60,-19,-11,-17,-6,-66,-2,-12,-35,22,49,-61,-15,235,-24,-79,-44,62,136,41,16,310,123,148,104,-47,114,159,300,229,82,58,-10,0,-5,-13,-37,-103,891,1000,-3,-47,-123,-19,86,155,-4,-71,-54,-22,-13,-16,-134,-29,71,87,35,-113,-20,-7,-21,-13,-7,279,28,57,8,-32,-54,56,-63,-34,3,-3,69,29,13,18,45,-86,-124,-8,8,-7,-54,-3,42,0,-17,31,-10,-4,-37,-40,-49,-4,-88,69,-42,-6,54,-49,11,-5,-9,116,26,19,33,28,-123,-159,-20,19,24,67,30,132,206,41,33,-100,35,71,5,15,102,136,115,49,-43,59,95,51,51,349,282,88,70,-29,-11,113,51,-7,-12,-28,96,-10,-44,-35,4,104,75,-7,-6,-16,-48,-52,-23,-25,-1,154,-25,25,-116,-18,-34,-43,-55,-3,36,134,68,0,-11,40,-5,-105,-62,-39,-7,47,65,63,39,14,48,-33,-28,-27,16,-132,3,103,-6,196,35,90,23,-8,-35,-29,-2,67,-12,631,142,75,-17,-5,-53,-42,-236,-85,249,150,40,33,71,-15,56,-14,84,-35,41,19,9,0,-54,-14,-16,78,-4,93,86,95,-50,97,-142,19,116,-68,-2,-73,325,0,-53,-29,-291,-65,36,-12,-62,-183,-34,39,62,-16,-22,-5,-13,103,-35,-60,-18,8,-6,41,40,-3,105,-36,-3,0,-16,-65,102,-31,-36,-32,-30,72,-62,63,-22,-11,38,37,-8,-76,-120,-66,87,62,-6,-45,68,-16,-32,-28,-195,63,-3,65,74,-2,-87,-1,-156,-473,-97,-59,156,-53,67,174,-86,30,-13,-25,-77,-1,67,46,59,-33,121,-2,-59,48,-95,-198,-99,19,-8,-101,75,31,5,-29,-236,-198,-223,-25,-95,-111,-42,-13,-5,36,-3,-17,-324,-153,-156,-25,-27,-13,14,92,-6,-8,-16,-5,-26,79,72,-31,4,140,-31,-27,-7,-40,-16,-7,34,-6,-20,90,-47,-12,-11,98,-15,-13,-92,-24,15,-33,-52,-117,-7,123,-24,-3,-57,19,17,-42,-86,-23,63,-34,51,-11,-40,-2,20,-51,-98,-210,31,-83,-102,-15,51,-29,0,-3,-297,-7,36,-32,-35,83,-35,-134,-141,-157,-151,-56,73,-22,-25,-4,75,-84,-152,-1,-150,-28,-80,15,2,-135,-27,-7,-6,0,-17,-12,-3,-3,-13,-10,-2,-1,-3,16,-70,-11,-9,71,-147,36,136,-45,-38,77,-5,55,-44,-5,-5,-19,51,-4,-12,-46,-9,-33,14,-43,-14,-57,-9,-15,-113,46,31,33,84,-63,-51,10,-202,-23,25,-3,122,170,-81,-104,-32,64,-78,-8,-38,95,-19,-64,-197,-77,-133,-29,-10,-32,-43,-55,115,24,-89,-89,-31,-24,-17,-73,-171,-22,49,12,-7,63,92,52,-50,-45,-58,-6,-16,-45,-18,21,-37,-42,-24,-93,-219,-17,-7,37,-9,-24,-30,0,-46,-102,-173,-16,65,-1,-34,1,-4,-8,-77,-66,-216,-14,54,-30,-11,-39,-2,-44,-119,8,-56,-106,64,-12,-16,0,-148,-53,79,-20,-56,-34,50,-23,-37,-136,-28,-14,-20,68,153,60,-7,-50,-6,-80,-46,47,-17,-116,135,113,-8,-162,-276,-107,-75,12,-114,-29,291,25,-9,61,-239,-33,-28,-30,-33,-10,57,49,-11,-1,-18,-26,-14,-31,-160,62,-55,44,38,36,-1,-13,-54,-129,-107,-6,-21,-104,-3,-22,-15,50,-19,-10,-97,-37,-8,-2,-47,-2,-55,-127,-85,-45,-44,-16,-61,-25,-44,-4,-16,-63,-4,-26,-66,-57,-9,46,28,-8,-11,-3,27,-75,-102,-51,-53,-19,22,41,-41,-6,-1,-18,-96,-4,-4,-22,-50,-1,-138,-16,53,-122,-349,-70,-20,-51,-46,-197,-14,-87,-21,-35,-243,95,61,-28,-5,-92,-53,-2,-43,-34,-35,-135,12,-12,-19,-63,-124,0,-40,-10,-32,10,-35,-29,-2,-60,-364,-19,71,-7,0,39,-131,-8,-59,-18,-16,-136,-17,-7,-4,-65,-37,-4,-26,48,11,-23,-201,-61,-12,-109,-10,3,-2,-5,558,12,-216,-21,44,-148,-1,-2,-61,54,185,-9,-1,14,-48,-86,-73,-17,-173,-96,148,110,-18,-66,-249,-46,-152,-41,-12,-71,-255,-28,-20,-29,-517,-25,0,-9,-1,-4,-16,-198,-39,-3,-29,-16,80,-8,-21,-16,-24,-331,-123,-45,-52,35,50,-18,-41,-3,9,48,131,-23,-21,-8,-14,-65,-21,-105,-15,-59,63,-2,-30,-23,-79,-5,0,-5,-149,-50,-51,26,-44,-24,-58,-19,-54,0,-109,-39,-149,-66,-40,-80,-110,-4,-5,-30,107,-11,-228,-13,17,-11,-33,47,-1,-5,151,-2,-26,-3,39,-72,-181,-5,-33,9,73,74,-26,-72,-3,-4,-19,-2,-37,64,-16,-36,-20,-5,-20,-96,-120,-80,25,-24,-4,-29,-31,87,-55,-28,-15,-60,-9,-116,-271,-307,-147,-23,-14,-8,44,-15,-15,-17,-9,-18,-141,-64,-59,-133,11,-126,-42,65,-33,72,38,-70,-24,-79,49,25,-151,-2,-48,-38,41,-27,-3,-2,-19,-3,-108,-9,-84,-150,-118,-65,-286,-111,-8,165,-45,110,137,-6,-19,-55,-52,60,5,48,270,89,105|0,10,10,10,10,10,10,10,10,10,10,10,10,10,10,10,10,10,10,10,10,10,10,10,10,10,10,10,10,10,10,10,10,10,10,10,10,10,10,10,10,10,10,10,10,10,10,10,10,10,10,10,10,10,10,10,10,10,10,10,10,10,10,10,10,10,10,10,10,10,10,10,10,10,10,10,10,10,10,10,10,10,10,10,10,10,10,10,10,10,10,10,10,10,10,10,10,10,10,10,10,10,10,10,10,10,10,10,10,10,10,10,10,10,10,10,10,10,10,10,10,10,10,10,10,10,10,10,10,10,10,10,10,10,10,10,10,10,10,10,10,20,10,10,10,10,10,10,10,10,10,10,10,10,10,10,10,10,10,10,10,10,10,10,10,10,10,10,10,10,10,10,10,10,10,10,10,10,10,10,10,10,10,10,10,10,10,10,10,10,10,10,10,10,10,10,10,10,10,10,10,10,10,10,10,10,10,10,10,10,10,10,10,10,10,10,10,10,10,10,10,10,10,10,10,20,10,10,10,10,10,10,10,10,10,10,10,10,10,10,10,10,10,10,10,10,10,10,10,10,10,10,10,10,10,10,10,10,10,10,10,10,10,10,10,10,10,10,10,10,10,10,10,10,10,10,10,10,10,10,10,10,10,10,10,10,10,10,10,10,10,10,10,10,10,10,10,10,10,10,10,10,10,10,10,10,10,10,10,10,10,10,10,10,10,10,10,10,10,10,10,10,10,10,10,10,10,10,10,10,10,10,10,10,10,10,10,10,10,10,10,10,10,10,10,10,10,10,10,10,10,10,10,10,10,10,10,10,10,10,10,10,10,10,10,10,10,10,10,10,10,10,10,10,10,10,10,10,10,10,10,10,10,10,10,20,10,10,10,10,10,10,10,10,10,10,10,10,10,10,10,10,10,10,10,10,10,10,10,10,10,10,10,10,10,10,10,10,10,10,10,10,10,10,10,10,10,10,10,10,10,10,10,10,10,10,10,10,10,10,10,10,10,10,10,10,10,10,10,10,10,10,10,10,10,10,10,10,10,10,10,10,10,10,10,10,10,10,10,10,10,10,10,10,10,10,10,10,10,10,10,10,10,10,10,20,10,10,10,10,10,10,10,10,10,10,10,10,10,10,10,10,10,10,10,10,10,10,10,10,10,10,10,10,10,10,10,10,10,10,10,10,10,10,10,10,10,10,10,10,10,10,10,10,10,10,10,10,10,10,10,10,10,10,10,10,10,10,10,10,10,10,10,10,10,10,10,10,10,10,10,10,10,10,10,10,10,10,10,10,10,10,10,10,10,10,10,10,10,10,10,10,10,10,20,10,10,10,10,10,10,10,10,10,20,10,10,10,10,10,10,10,10,10,10,10,10,10,10,10,10,10,10,10,10,10,10,10,10,10,10,10,10,10,10,10,10,10,10,10,10,10,10,10,10,10,10,10,10,10,10,10,10,10,10,10,10,10,10,10,10,10,10,10,10,10,10,10,10,10,10,10,10,10,10,10,10,10,10,10,10,10,10,10,10,10,10,10,10,10,10,30,10,10,10,10,10,10,10,10,10,10,10,10,10,10,10,10,10,10,10,10,10,10,10,10,10,10,10,10,10,10,10,10,10,10,10,10,10,10,10,10,10,10,10,10,10,10,10,10,10,10,10,10,10,10,10,10,10,10,10,10,10,10,10,10,10,10,10,10,10,10,10,10,10,10,10,10,10,10,10,10,10,10,10,10,10,10,10,10,10,10,10,10,10,10,10,10,20,10,10,10,10,10,10,10,10,10,10,10,10,10,10,10,10,10,10,10,10,10,10,10,10,10,10,10,10,10,10,10,10,10,10,10,10,10,10,10,10,10,10,10,10,10,10,10,10,10,10,10,10,10,10,10,10,10,10,10,10,10,10,10,10,10,10,10,10,10,10,10,10,10,10,10,10,10,10,10,10,10,10,10,10,10,10,10,10,10,10,10,10,10,10,10,10,10,10,10,10,10,10,10,10,10,10,10,10,10,10,10,10,10,10,10,10,10,10,10,10,10,10,10,10,10,10,10,10,10,10,10,10,10,10,10,10,10,10,10,10,10,10,10,10,10,10,10,10,10,10,10,10,10,10,10,10,10,10,10,10,10,10,10,10,10,10,10,10,10,10,10,10,10,10,10,10,10,10,10,10,10,10,10,10,10,10,10,10,10,10,10,10,10,10,10,10,10,10,10,10,10,10,10,10,10,10,10,10,10,10|-161,-70,111,67,-162,-38,-90,-134,18,-63,-66,-87,-33,-3,-13,-54,-58,-233,-88,-17,-144,-177,-76,-79,-8,-59,-151,-318,-62,-381,-113,0,-845,-93,-218,-81,-74,-190,-100,-41,10,-193,-1207,-87,-32,130,93,-349,-449,-205,-43,129,-269,-147,171,-7,125,-31,-392,-476,-200,58,144,-10,-37,-505,-28,-20,117,-20,266,-7,-46,-173,79,-206,-22,-361,-110,-158,-2,-108,-532,-90,-81,66,65,-7,-115,-85,-8,-11,-66,-68,20,-36,-72,-68,-4,-65,-40,-232,77,127,-116,87,-27,-23,-150,-47,-8,35,-54,-223,26,-251,-1,-364,-188,-109,-187,-137,-111,-228,-262,26,-193,-258,-8,-55,-252,0,-43,-807,-691,-642,-4,-25,-50,-2,-103,-613,-211,-357,-2,-11,-40,-175,-278,-110,34,-7,-556,-21,-29,-43,0,-245,-363,-4,-73,61,-9,-275,-329,-190,-58,-199,374,-15,-11,-43,-35,-187,-49,-212,-167,-495,-327,-48,102,-13,-184,-28,-185,-75,-416,-389,-204,-270,-172,-98,-33,-11,-637,-78,-142,-159,-32,-15,-10,104,-49,100,-252,-103,-58,-63,-245,-21,140,157,149,-46,-160,-203,100,29,-297,-220,58,160,-315,-51,-149,-22,23,-83,-282,47,-118,-143,-56,544,-40,-139,-582,-175,-272,-145,-54,-102,-301,-158,-26,-206,-466,-149,-304,-22,-16,-289,-8,247,112,197,-412,-33,91,100,129,113,-153,-223,0,-263,-34,-26,-274,293,-91,-739,-945,-260,-22,-9,-208,-205,-13,-198,-207,-220,-686,-126,-208,121,-496,-353,-686,-96,-413,-8,0,-411,-34,-126,181,52,-404,-416,-398,1,-237,-815,-38,117,77,-19,-22,71,119,-158,-2,-27,-56,182,-50,-87,-167,-751,-282,-416,-302,-11,-174,-153,-83,-57,-104,-24,-236,-568,-224,-60,-95,-97,-98,-175,-83,-343,-128,-166,-115,-75,-64,-28,-55,-216,232,-21,-153,-280,112,219,-29,-8,-40,-176,-60,192,108,-118,-531,-528,263,9,-60,-251,-115,-2,-177,-228,-903,-597,-168,-83,-284,-43,27,-134,-15,-146,-1055,-307,-5,-151,-146,-256,-4,-44,-164,-29,-75,-38,126,-38,-68,-423,-178,-231,-10,86,-56,-134,-14,-4,154,-149,-136,141,39,95,-16,-102,90,-14,-118,-92,-228,-253,-165,-269,53,-200,-248,-271,318,-405,-292,-131,-56,-236,-498,-487,-119,-230,154,134,-272,-59,152,-230,-228,-330,205,-85,-177,-95,-16,-74,-101,-271,-3,-143,-237,-326,-55,118,140,-56,-356,-292,-101,108,-15,-374,134,-84,426,-51,-216,-474,-667,-42,-70,-177,-16,-38,-154,-37,-91,-472,-450,-302,23,386,-216,-143,-112,-96,-51,-399,-13,-14,-9,-17,-711,-460,-572,-249,-228,-115,-38,-35,57,-71,-90,-864,-215,132,90,93,-29,-5,-20,282,-162,-293,-6,40,136,-116,-17,68,-165,18,-175,-107,-368,200,-4,-285,-743,-361,-234,79,-149,-313,-71,144,-780,-406,-839,-77,-121,90,-48,-5,-87,-57,-137,-321,-597,-258,-64,222,-148,96,-279,-369,-10,-62,-112,-32,-106,98,-15,-39,-483,-47,-2,-47,51,81,-32,147,-11,-249,-319,-277,-189,-45,289,155,-5,-7,-200,-43,-863,-25,-64,454,143,-131,-48,-637,-257,-21,36,813,371,64,0,46,-162,-805,-550,-5,83,198,0,-234,-523,-299,-484,-424,-200,-96,101,182,-6,-101,-84,-101,-63,-130,-130,-143,-192,-276,-394,-64,-265,-42,-19,-283,-77,-94,-300,-205,-164,-408,93,381,-65,-59,-527,-362,-109,-70,-62,401,700,-246,-63,-153,-203,-112,162,-32,-31,-93,-38,-100,-203,-73,-8,-90,-241,-80,-99,45,188,-64,-282,-33,-187,-58,-151,-11,-11,155,-28,-20,-102,-5,-65,-241,96,-117,223,155,-14,-90,105,-148,318,-91,66,-85,105,-9,111,-263,-56,113,156,197,-32,-263,-424,-314,-113,-205,-342,-33,-29,240,-27,-14,-268,-37,-203,-1085,-66,-267,-650,-525,-20,-16,-96,140,-52,-22,-51,-305,-40,-141,-44,-5,90,-65,-72,-28,-160,-147,-198,-1,82,-32,304,-55,-129,-23,-213,-2,-17,-14,-14,50,999,-132,-58,-97,-54,-145,59,-120,-130,375,368,484,-60,-149,-404,-27,-61,-165,210,106,-74,-161,240,-231,-74,-103,-23,-6,128,-10,-180,-439,187,328,153,280,-13,-75,236,-5,-28,-42,139,109,-9,-38,-19,141,-62,-83,-279,-163,-825,-10,69,-63,56,-73,141,188,139,-1774,-2845,-281,-2,-58,-14,-81,-36,196,89,-118,-319,-31,53,-45,-4,-82,-361,-25,-149,-263,-23,-49,-128,60,-82,-79,-97,-93,395,-1,-42,21,-22,-55,-247,0,164,258,912,-182,183,-78,-4,170,-51,-45,345,565,190,331,176,-380,-7,84,-46,-186,-200,112,-7,-72,66,-128,-82,-21,-34,-185,-1,-150,-93,-3,116,-5,-64,-18,-105,-87,-131,-77,-73,-57,137,-46,-8,-164,-101,-62,-108,-142,18,-35,-83,-5,77,-13,133,-1,83,-16,-72,-127,-87,-52,-26,-29,0,-50,87,103,-9,-206,27,-191,-54,-285,-255,-261,-197,-1,170,-64,-87,-42,-12,-133,-328,-293,-419,-110,-109,-39,115,56,-183,-3,-367,-159,-162,92,-17,-25,-91,-18,-19,-61,282,-28,-108,338,-107,110,-125,-163,-66,-242,-294,-667,-416,-435,-2,-43,-43,-295,-10,-105,-203,-133,-149
For more models, see a link on bio (description length limitation in this description restricts me to publish more).
Unimportant details
===============
“Neon” is the project code name, “J” is the iteration (versions “A” to “I” all led to a solid “J”)
Formatting options here make formatting very difficult, so forgive me poor readability.
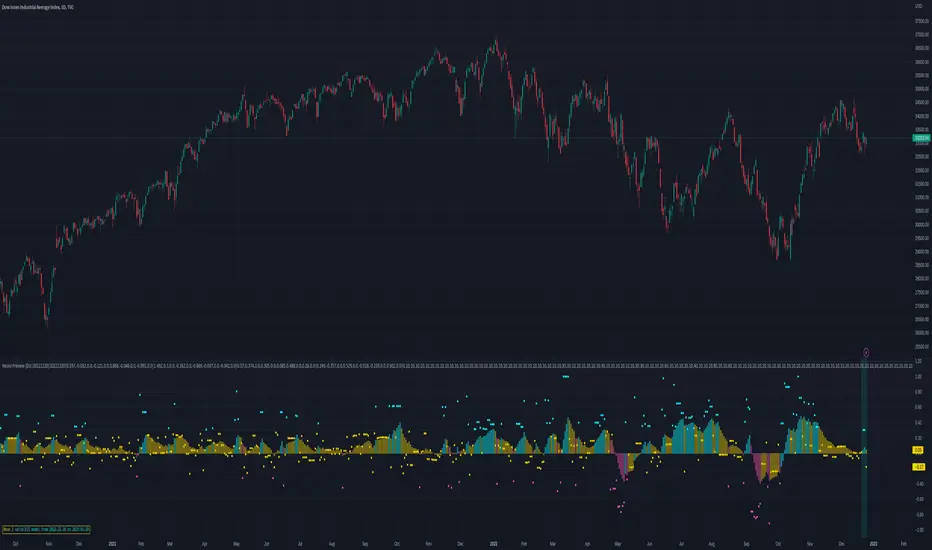
Auto Trend Lines Breakouts and Bounces Signals and AlertsAuto Trend Lines Breakout with Confirmation Bounce Signals and Alerts
This indicator draws trend lines automatically based on the 2 pivot points, which are calculated based on the specified number of bars (length), which is of course customizable. The indicator then shows you when these trend lines get touched (potential bounce) or “almost touched” (Yes! The script can do that as well!) by the current price of the instrument or broken and then confirmed by the “after break come back touch” – classic! Everything is shown on the chart, and for everything - alarms can be set up with just a few clicks!
Now there are 2 modes here (you can hide all signals as well and just use the trend lines):
1) Current/recent trend lines only: will only show 2 current upper/lower trend lines as well as previous 2 for reference.
2) All time (historical) trend lines: will show 2 current upper/lower trend lines as well as the historical lines from the past and these lines are often very respected by the price!
Besides that, you can set the indicator to show you exactly what you want: Just the trend lines touches/bounces, breaks with confirmation touches/bounces or BOTH.
In addition to that, you can set the indicator to only show you these touches/bounces and breaks with additional confirmations, only if confirmed by :
- Moving Average (customizable length): LONG signals based off the trend lines will only be shown if above EMA, SHORT if below.
- Signals where the candle color confirms the direction of the trade, but the candle type is opposite (like a green colored bearish hammer for example) will be avoided (such candles can be very uncertain/deceptive)
- Signals where the signal candle is doji will be avoided (uncertain)
- Signals will only be shown if supported by the trend line slope (for example, with this feature turned on, if there is an upper line trend line, but the line is actually above, touching the top of the candles and the price touches/crosses it or it gets broken – there will be no signal as even though the trend line is an upper line above candles, it’s slope is positive (going up), if the slope would be down, like a classical down/bearish trend line and the price touches/bounces off it or the line gets broken, only then the indicator will show the signal/alert.
- OFFSET: this one is really cool! With this feature you can hunt these conditions when the price comes very near the trend line, but never touches it. With this setting turned on, with a correct offset amount – you will be able to catch these! You will need to play around with the offset amount, depending on the timeframe/instrument, be quick-n-easy!
The indicator also includes Round Number lines on the chart, which are customizable for any instrument. As you know round numbers are appreciated by the price and can be very nicely used with this indicator looking for combos or using trend lines for signals, while round numbers as partial profit price targets or stop-loss areas.
Important economic events are also shown on the chart as red vertical lines (during these events, volatility can suddenly spike, so it’s best to stay away from trading!)
This is a very powerful indicator with plenty of customizations to find the best approaches, can be used for any instrument and on any timeframe! Awesome for scalping and could be used with swing trading as well! Enjoy!
To add the alerts
-Right-click anywhere on the TradingView chart
-Click on Add alert
-Condition: Auto Trend Lines Breakout with Confirmation Bounce Signals and Alerts
-Alert name: DO NOT TOUCH THIS
-Hit “Create”
-Note: If you change ANY Settings within the indicator – you must DELETE the current alert and create a new one per steps above, otherwise it will continue triggering alerts per old Settings!
A few strategies how this indicator can be used (these were actually tested and showed awesome results!):
1) Bounce Scalping: Simply hunting bounces off the trend lines. Often the price will slightly cross the trend line and then immediately bounces from it for nice little price move, which is great for scalping or if you for example take 2/3s off the position and leave the remaining, often with such bounces – the price may reverse from the trend line and go in the opposite direction considerably.
2) Break-Bounce-Confirm: this is the “Breaks with Confirmation Bounce” option of the script which fully automates the classical trend lines break confirmation, where the trend line is broken (which could be a fake out), so you wait for a touch/bounce of that trend line back from the initial break and open the position right there or wait and see if after the touch/bounce back, the price once again goes into the direction of the break.
For stop-loss and take-profit areas, you can use:
1) Pivots (these are marked with red and green crosses on the chart), which are used to draw the actual trend lines.
2) The actual trend lines themselves (if one gets broken + confirmation, you can set your stop-loss if that same line gets broken again in the opposite direction | similar for take-profit, you can take profit or partial profit at next trend line on the chart if the price reaches it.
3) Use the Round Numbers included, for example: use the closest round number as a visual soft stop-loss and the furthest one away as a visual soft take-profit.
You can try combining this indicator with divergence, stochastic, Bollinger bands, pretty much anything!
If you wish to try this out for a week or so – please reach out and I will give you access.

Helicopter!Review
This indicator automatically calculates the best trade entry based on volume and real-time volatility. After the algorithm analyzes the current characteristics of the market, an entry signal is placed on the chart. As a result, the trader can be sure that the signal is based on data analysis. One of the key elements is reverse transactions. A long or short position can be stopped either at a profit or at a small loss without compromising the potential profit.
!Risks
The market is unstable, and it is impossible to know what the future holds for it. The only way to manage risk. You can limit the loss by setting a stop loss of 1% from the entry point. Take profit is recommended to set with a ratio of 1:1, 1:2,1:3, with partial fixation of 40%, 30%, 30%!
!Trading recommendations
Trades are opened when a green arrow appears, selling when a yellow arrow appears. Be sure to wait for the candle to close and the signal to appear (the signal may flash when the candle is formed). Recommended timeframes: 1min, 3min, 15min. The indicator is designed for scalp trades and intradays!
!Technical part
The indicator is based on the EMA 20 and EMA 200 moving averages. It is also based on the open and close of past days, weeks, months.
RSI are used.
RSI is a classic oscillator built on the basis of calculating the relative rate of change in asset prices over a given period.
Additional tools: volume and volatility.
NO REPAINT!
-------------------------------------------------------
Denial of responsibility
The information contained in my Scripts/Indicators/Ideas/Algorithms/Systems does not constitute financial advice or an offer to buy or sell any securities of any kind. I do not accept liability for any loss or damage, including but not limited to any loss of profits that may arise directly or indirectly from the use of or reliance on such information.
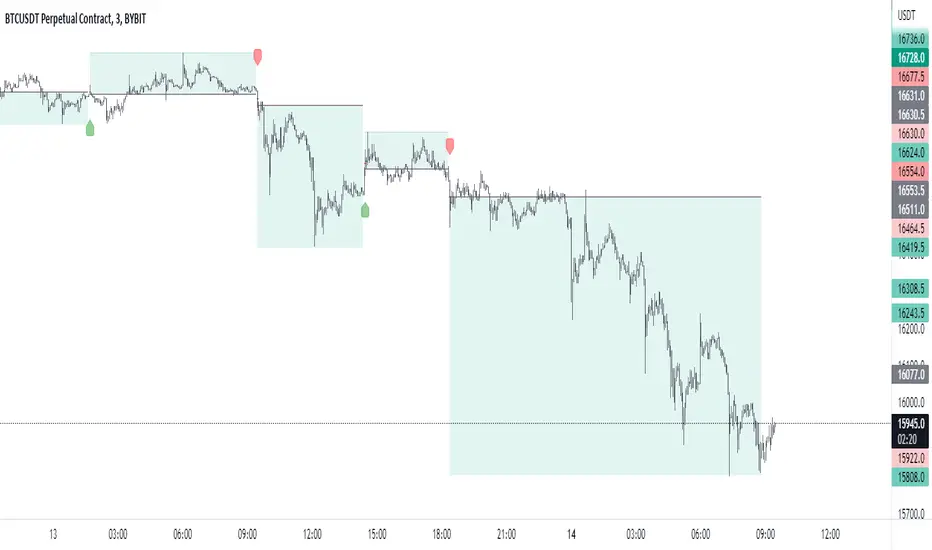
Multi-Panel: Trade-Volatility-Probability [Loxx]Multi-Panel: Trade-Volatility-Probability shows user selected and volatility-based price levels and probabilities on the chart. This is useful for both options and all styles of up/down trading methods that rely on volatility.
Trading Panel: Shows trading information to take profits and stop-loss based on multiples of volatility. Also shows equity inputs by the user to calculate optimal position size
Key things to note about the Trading Panel
-Trade side: Long or short. you change this this to change the take profit and SL levels in displayed on the table to be used w/ up/down trading styles that rely on volatility stops
-Account size: User enters total balance available for trade
-Risk: Total % of account size you're willing to lose should the SL be hit
-Position size: Size of the position given the SL and your preferred Risk
-Take profit/Stop loss levels: Based on multipliers selected by the user in settings. These shouldn't be changed unless you really know what you're doing with volatility stops
-Entry: Source price. can be 1 of 37 different prices. See Loxx's Expanded Source Types:
Volatility Panel: Shows information about the volatility the user selected to be used to take profit/stop-loss/range calculations. Volatility types included are:
Close-to-Close
Close-to-Close volatility is a classic and most commonly used volatility measure, sometimes referred to as historical volatility .
Volatility is an indicator of the speed of a stock price change. A stock with high volatility is one where the price changes rapidly and with a bigger amplitude. The more volatile a stock is, the riskier it is.
Close-to-close historical volatility calculated using only stock's closing prices. It is the simplest volatility estimator. But in many cases, it is not precise enough. Stock prices could jump considerably during a trading session, and return to the open value at the end. That means that a big amount of price information is not taken into account by close-to-close volatility .
Despite its drawbacks, Close-to-Close volatility is still useful in cases where the instrument doesn't have intraday prices. For example, mutual funds calculate their net asset values daily or weekly, and thus their prices are not suitable for more sophisticated volatility estimators.
Parkinson
Parkinson volatility is a volatility measure that uses the stock’s high and low price of the day.
The main difference between regular volatility and Parkinson volatility is that the latter uses high and low prices for a day, rather than only the closing price. That is useful as close to close prices could show little difference while large price movements could have happened during the day. Thus Parkinson's volatility is considered to be more precise and requires less data for calculation than the close-close volatility.
One drawback of this estimator is that it doesn't take into account price movements after market close. Hence it systematically undervalues volatility. That drawback is taken into account in the Garman-Klass's volatility estimator.
Garman-Klass
Garman Klass is a volatility estimator that incorporates open, low, high, and close prices of a security.
Garman-Klass volatility extends Parkinson's volatility by taking into account the opening and closing price. As markets are most active during the opening and closing of a trading session, it makes volatility estimation more accurate.
Garman and Klass also assumed that the process of price change is a process of continuous diffusion (geometric Brownian motion). However, this assumption has several drawbacks. The method is not robust for opening jumps in price and trend movements.
Despite its drawbacks, the Garman-Klass estimator is still more effective than the basic formula since it takes into account not only the price at the beginning and end of the time interval but also intraday price extremums.
Researchers Rogers and Satchel have proposed a more efficient method for assessing historical volatility that takes into account price trends. See Rogers-Satchell Volatility for more detail.
Rogers-Satchell
Rogers-Satchell is an estimator for measuring the volatility of securities with an average return not equal to zero.
Unlike Parkinson and Garman-Klass estimators, Rogers-Satchell incorporates drift term (mean return not equal to zero). As a result, it provides a better volatility estimation when the underlying is trending.
The main disadvantage of this method is that it does not take into account price movements between trading sessions. It means an underestimation of volatility since price jumps periodically occur in the market precisely at the moments between sessions.
A more comprehensive estimator that also considers the gaps between sessions was developed based on the Rogers-Satchel formula in the 2000s by Yang-Zhang. See Yang Zhang Volatility for more detail.
Yang-Zhang
Yang Zhang is a historical volatility estimator that handles both opening jumps and the drift and has a minimum estimation error.
We can think of the Yang-Zhang volatility as the combination of the overnight (close-to-open volatility ) and a weighted average of the Rogers-Satchell volatility and the day’s open-to-close volatility . It considered being 14 times more efficient than the close-to-close estimator.
Garman-Klass-Yang-Zhang
Garman Klass is a volatility estimator that incorporates open, low, high, and close prices of a security.
Garman-Klass volatility extends Parkinson's volatility by taking into account the opening and closing price. As markets are most active during the opening and closing of a trading session, it makes volatility estimation more accurate.
Garman and Klass also assumed that the process of price change is a process of continuous diffusion (geometric Brownian motion). However, this assumption has several drawbacks. The method is not robust for opening jumps in price and trend movements.
Despite its drawbacks, the Garman-Klass estimator is still more effective than the basic formula since it takes into account not only the price at the beginning and end of the time interval but also intraday price extremums.
Researchers Rogers and Satchel have proposed a more efficient method for assessing historical volatility that takes into account price trends. See Rogers-Satchell Volatility for more detail.
Exponential Weighted Moving Average
The Exponentially Weighted Moving Average (EWMA) is a quantitative or statistical measure used to model or describe a time series. The EWMA is widely used in finance, the main applications being technical analysis and volatility modeling.
The moving average is designed as such that older observations are given lower weights. The weights fall exponentially as the data point gets older – hence the name exponentially weighted.
The only decision a user of the EWMA must make is the parameter lambda. The parameter decides how important the current observation is in the calculation of the EWMA. The higher the value of lambda, the more closely the EWMA tracks the original time series.
Standard Deviation of Log Returns
This is the simplest calculation of volatility . It's the standard deviation of ln(close/close(1))
Pseudo GARCH(2,2)
This is calculated using a short- and long-run mean of variance multiplied by θ.
θavg(var ;M) + (1 − θ) avg (var ;N) = 2θvar/(M+1-(M-1)L) + 2(1-θ)var/(M+1-(M-1)L)
Solving for θ can be done by minimizing the mean squared error of estimation; that is, regressing L^-1var - avg (var; N) against avg (var; M) - avg (var; N) and using the resulting beta estimate as θ.
Average True Range
The average true range (ATR) is a technical analysis indicator, introduced by market technician J. Welles Wilder Jr. in his book New Concepts in Technical Trading Systems, that measures market volatility by decomposing the entire range of an asset price for that period.
The true range indicator is taken as the greatest of the following: current high less the current low; the absolute value of the current high less the previous close; and the absolute value of the current low less the previous close. The ATR is then a moving average, generally using 14 days, of the true ranges.
True Range Double
A special case of ATR that attempts to correct for volatility skew.
Chi-squared Confidence Interval:
Confidence interval of volatility is calculated using an inverse CDF of a Chi-Squared Distribution. You can change the volatility input used to either realized, upper confidence interval, or lower confidence interval. This is included in case you'd like to see how far price can extend if volatility hits it's upper or lower confidence levels. Generally, you'd just used realized volatility, so I wouldn't change this setting.
Inverse CDF of a Chi-Squared Distribution
The chi-square distribution is a one-parameter family of curves. The parameter ν is the degrees of freedom.
The icdf of the chi-square distribution is
x=F^−1(p∣ν) = {x:F(x∣ν) = p}
where
p=F(x∣ν)= ∫ (t^(v-2)/2 * e^t/2) / (2^(v/2) / Γ(v/2))
ν is the degrees of freedom, and Γ( · ) is the Gamma function. The result p is the probability that a single observation from the chi-square distribution with ν degrees of freedom falls in the interval .
Additional notes on Volatility Panel
-Shows both current timeframe volatility per candle at whatever date backward you select
-Shows annualized volatility basaed on selected days per year and per bar volatility; this is automaitcally caulculated no matter the timeframe used. This means that it'll calculate annualized volatility for the current candle even on the 1 second timeframe. Days per year should be 252 for everything but cryptocurrency; however, for all types of tradable assets, anything over the 3 day timeframe will calculate on 365 days.
Probability Panel
This panel shows the probability levels of a user selected upper and lower price boundary. This includes the inside range of volatility between the lower and upper price levels and the outside probability below the lower price level and above the upper price level. These values are calculated using the CDF (cumulative density function) of a normal distribution. In simpler terms, CDF returns area under a bell curve between two points left and right, or for our purposes, high and low. This yeilds the probabilities you see in the Probability Panel. See the following graphic to visualize how this works:
The red line is the entry bar; the yellow line is the "mean" but in this case just the chosen source price.
Other things to know
You can turn on/off all labels and levels and fills
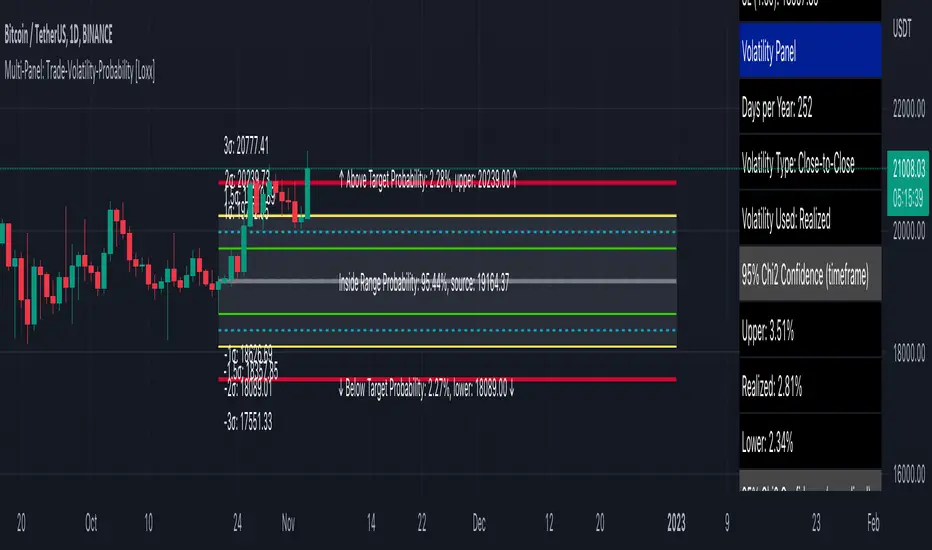
Curved Stop Loss (Expo)█ Overview
Curved Stop Loss (Expo) automatically calculates the best stop-loss distance based on real-time momentum and volatility. Once the algorithm has analyzed the current market characteristics, a curved stop loss is placed on the chart. As a result, the trader can be confident that the stop loss is based on data insights. One of the key elements of a curved stop loss is that it ensures that the trade can either be stopped with a profit or only with a minor loss without compromising the profit potential. Hence, using the Curved Stop Loss makes a massive difference in the overall results.
█ Why is this tool needed?
Risk management is a key concept to grasp and use in your trading, and it's one of the most critical aspects that will determine your long-term success in this industry. The market is uncertain, and it's impossible to know what the future holds. The only way to take control of the unknown is to have a proper risk management system that ensures you don't blow your account in one trade. Therefore, all traders need to understand the importance of using a risk- and money-management tool that calculates and provides stop-loss and take-profit levels in real-time. This way, you will always know where to take your stop loss and secure profit.
█ How to use
This Curved Stop Loss helps traders set a stop loss based on current momentum and volatility. It can be used to minimize your risk and maximize your profit potential.
-----------------
Disclaimer
The information contained in my Scripts/Indicators/Ideas/Algos/Systems does not constitute financial advice or a solicitation to buy or sell any securities of any type. I will not accept liability for any loss or damage, including without limitation any loss of profit, which may arise directly or indirectly from the use of or reliance on such information.
All investments involve risk, and the past performance of a security, industry, sector, market, financial product, trading strategy, backtest, or individual's trading does not guarantee future results or returns. Investors are fully responsible for any investment decisions they make. Such decisions should be based solely on an evaluation of their financial circumstances, investment objectives, risk tolerance, and liquidity needs.
My Scripts/Indicators/Ideas/Algos/Systems are only for educational purposes!
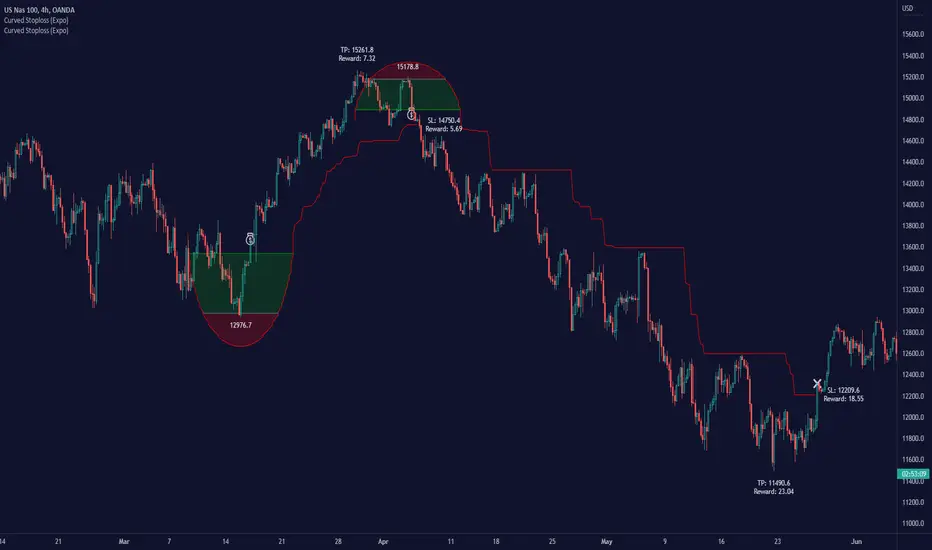
Profit Bands [Loxx]Profit Bands is a supplementary indicator to be used with Loxx's backtests and combination indicators that use volatility-based take profits and stop loss. This indicator includes two types of volatility: Average True Range and True Range Double. Additional volatility sources will be added in the future. The lines painted on the screen are multiples of ATR for Take Profits and Stoploss for Long/Short positions that you can change in the settings. 3 Take Profits and 1 Stoploss is supported. You can turn on/off each UI element. Position size is determined by calculating the size of an investment where you'd lose only X% of your balance if the Stoploss is hit. You can enter your total balance available to trade and the desired % risk you'd be willing to lose at SL. Typically this number is 1-2% of total balance per trade.
Always remember to wait for bar close on a signal to and then peg this indicator to 1 bar backward to fix the price levels the then seed the exact levels you'll use for Take Profits and Stoploss. This indicator will match exactly the levels in other indicators in Loxx's scripts such as Kaleidoscope. You would overlay this script over any other script that uses volatility stops to see where to place your TPs and SL

TRENDsignalsindicator_MTF► DESCRIPTION
This indicator calculate works in 2 directions:
1) Calculate SMA & VWAP trends at a fixed value: so it values the price actions according the VWAP level to reach the perfect entrypoint
2) Set the value found at a different timeframe(4Hs if u use tradingview TF of 15 mins)
This combination is useful to identify the trend
To help the trader, I placed BUY/SELL signals on the second candle of the same color changed.
Furthermore, I placed:
- HH and LL of the day(green and red lines) and of the current Week(white lines): these lines help the traders to identify the relative supports and resistances
- line red and gray(with big arrows at the start of them): to identify others supports and resistance
► HOW TO USE IT:
1) Entry when a signal(buy/sell) appears or when candles change color: yellow is long, red is short
2) Evaluate where the candle is: for example, if you get a signal "buy", near the Weekly line LL, it's the perfect entry point. The same is if u get a "SELL" signal near the upper white line, it's the perfect moment to enter short.
3) Take profit: we suggest to take profit when RSI is overbought or oversold, that we've pointed thanks the following signals:
- colored circles
- small diamonds
- white circles
- Big white diamonds
► Legend:
BARCOLORS: Yellow is long and red is short moment
MINIARROW buy/sell alert u when the color of candls change
COLORED CIRCLES: indicates when Rsi is oversold or overbought. We identify them like good moment to take profit
BIG ARROW: Identify support and resistance level
SMALL DIAMOND: Use it Like TP. Possible small swing of price can happen
WHITE CIRCLE: Use it Like TP. Possible small swing of price can happen
BIG WHITE DIAMOND: Use it Like TP. Possible big swing of price can happen
So it's suggested to trade just near this supports and resistence using the right direction: when you have a reversal signal near one of the daily or weekly line, it's a good moment to entry
PLEASE COMMENT HERE BELOW ANY QUESTION ABOUT THIS STUDY

Position Tool█ OVERVIEW
This script is an interactive measurement tool that can be used to evaluate or keep track of trades. Like the long and short position drawing tools, it calculates a risk reward ratio and a risk-adjusted position size from the entry, stop and take profit levels, but it also does much more:
• It can be used to configure long or short trades.
• All monetary values can be expressed in any number of currencies.
• The value of tick/pip movement (which varies with the position's size) is displayed in the currency you have selected.
• The CAGR ( Compound Annual Growth Rate ) for the trade can be displayed.
• It does live tracking of the position.
• You can configure alerts on entries and exits.
█ HOW TO USE IT
Load the indicator on an active chart (see here if you don't know how).
When you first load this script on a chart, you will enter an interactive selection mode where the script asks you to pick three points in price and time on your chart by clicking on the chart. Directions will appear in a blue box at the bottom of the screen with each click of the mouse. The first selection is the entry point for the trade you are considering, which takes into account both the time and level you choose, the next are the take profit and stop levels. Once you have selected all three points, the script will draw trade zones and labels containing the trade metrics. The script determines if the trade is a long or short from the position of the take profit and stop loss levels in relation to the entry price. If the take profit level is above the entry price, the stop must be below and vice versa, otherwise an error occurs.
You can change levels by dragging the handles that appear when you select the indicator, or by entering new values in the script's settings. The only way to re-enter interactive mode is to re-add the indicator to your chart.
Once you place the position tool on a chart, it will appear at the same levels on all symbols you use. If your scale is not set to "Scale price chart only", the position tool's levels will be taken into account when scaling the chart, which can cause the symbol's bars to be compressed. If your scale is set to "Scale price chart only", the position tool will still be there, but it will not impact the scale of the chart's bars, so you won't see it if it sits outside the symbol's price scale.
If you select the position tool on your chart and delete it, this will also delete the indicator from the chart. You will need to re-add it if you want to draw another position tool. You can add multiple instances of the indicator if you need a position tool on more than one of your charts.
█ FEATURES
Display
The position tool displays the following information for entries:
• The entry's price level with an '@' sign before it.
• Open or Closed P&L : For an open trade, the "Open P&L" displays the difference in money value between the entry level and the chart's current price.
For a closed trade, the "Closed P&L" displays the realized P&L on the trade.
• Quantity : The trade size, which takes into account the risk tolerance you set in the script's settings.
• RR : The reward to risk ratio expresses the relationship of the distance between the entry and the take profit level vs the entry and the stop level.
Example: A $100 stop with a $100 target will have a ratio of 1:1, whereas a $200 target with the same stop will have a 2:1 ratio.
• Per tick/pip : Represents the money value of a tick or pip movement.
• CAGR : The Compound Annual Growth Rate will be displayed on the main order label on trades that exceed one day in duration.
This value is calculated the same way as in our CAGR Custom Range indicator.
If the trade duration is less than one day, the metric will not be present in the display.
The stop and take profit levels display:
• Their price level with an '@' sign before it.
• Their distance from the entry in money value, percentage and ticks/pips.
• The projected end money value of the position if the level is reached. These values are calculated based on the trade size and the currency.
Currency adjustments
This indicator modifies the trade label's colors and values based on the final Profit and Loss (P&L), which considers the dynamic exchange rate between base and conversion currencies in its calculations when the conversion currency is a specified value other than the default. Depending on the cross rate between the base and account currencies, this process can yield a negative P&L on an otherwise successful simulated trade.
For instance, if your account is in currency XYZ, you might buy 10 Apple shares at $150 each, with the XYZ to USD exchange rate being 2:1. This purchase would cost you 3000 units of XYZ. Suppose that later on, the shares appreciate to $170 each, and you decide to sell. One might expect this trade to result in profit. However, if the exchange rate has now equalized to 1:1, the return on selling the shares, calculated in XYZ, would only be 1700 units, resulting in a loss of 1300 units XYZ.
The indicator will mark the P&L and the target labels in red in such cases, regardless of whether the market price reached the profit target, as the trade produced a net loss due to reduced funds after currency conversion. Conversely, an otherwise unsuccessful position can result in a net profit in the account currency due to conversion rate fluctuations. The final losses or gains appear in the label metrics, and the corresponding color coding reflects the trade's success or failure.
Settings
The settings in the "Trade sizing" section are used to calculate the position size and the monetary value of trades. Two types of risk can be chosen from the menu; a percentage based risk calculation, or a fixed money value. The risk is used to calculate the quantity of units to purchase to achieve that level of risk exposure. Example: An account size of $1000 and 10% risk will have a projected end amount of $900 if the stop loss is hit. The quantity is a product of this relationship; a projected number of units to allow for the equivalent of $100 of risk exposure over the change in price from the entry to the stop value.
The "Trade levels" allow you to manually set the entry, take profit and stop levels of an existing position tool on your chart.
You can control the appearance of the tool and the values it displays in the settings following these first two sections.
Alerts
Three alerts that will trigger when you configure an alert on this indicator. The first will send an alert when the entry price is breached by price action if that price has not already been breached in the previous price history. This is dependant on the entry location you select when placing the indicator on the chart. The other two alerts will trigger when either the stop loss or the take profit level is breached to signal that a trade exit has occurred.
█ NOTES FOR Pine Script™ CODERS
• Interactive inputs are implemented for input.time() and input.price() . These specialized input functions allow users to interact with a script.
You can create one interactive input for both time and price values by using the same `inline` argument in a pair of input.time() and input.price() function calls.
• We use the `cagr()` function from our ta library.
• The script uses the runtime.error() function to throw an error if the stop and limit prices are not placed on opposing sides of the entry price.
• We use the `currency` parameter in a request.security() call to convert currencies.
Look first. Then leap.

Wavetrend DivergencesCreated for the MarketCipher Community and friends :)
This indicator is partly based on Wavetrend Oscillator by LazyBear / blue momentum waves on MarketCipher B.
The Wavetrend indicator is a combination of 2 oscillator lines that signals the short term direction of the price once the lines cross. The Wavetrend indicator is useful but only once a divergence has been identified based on the crosses and the price which is what this strategy partly uses to open trades. This indicator signals divergences in the wavetrend, both regular and hidden divergences.
This indicator utilizes support and resistances to make sure that the indicator only signals high probability winning divergences. Supports represents a low level a stock price reaches over time, while resistance represents a high level a stock price reaches over time. Support materializes when a stock price drops to a level that prompts traders to buy. This reactionary buying causes a stock price to stop dropping and start rising and this is where the indicator will be looking for a divergence at a price point of your choosing.
To make it easier i have added a support and resistance drawing indicator that will help you find price points on the chart that the price is likely to get a reaction from. There are right now only 4 support or resistances that can be drawn at one time so make sure to update the levels as the market changes.
I have helped update and modify from the original script. Here it is:
On top of these indicators i have added my own indicator that will signal a short term trend reversal that is based on pivot points and moving averages. This will usually signal reversals earlier than divergences and is very effective when following the trend and using support and resistances and can be used as an extra confirmation that there will be a reaction from the support or resistance and that the divergence will play out like you want it to. These trend reversal dots can also be used to take profit.
Trade setup example:
As seen in the picture below price comes down to a previously drawn support line, then there is a trend reversal dot that signal a potential reversal and finally a divergence is signalled once there is a clear reaction to the support. When all these signals come together there is a high probability that the trade will end up in profit. To take profit in this trade setup you can use the trend reversal dots, the drawn resistances or your own intuition and technical analysis with Marketcipher B and DBSI. A stop loss in this trade setup could be at the swing low, below the blue or teal line.
There are alerts for everything so that you wont miss a trade setup. Hope you like it :)
I have some ideas on how to improve the indicator so there will be updates in the future.

SuperTrend Entry(My goal creating this indicator) : Provide a way to enter the market systematically, automatically create Stop Loss Levels and Take Profit Levels, and provide the position size of each entry based on a fix Percentage of the traders account.
The Underlying Concept :
What is Momentum?
The Momentum shown is derived from a Mathematical Formula, SUPERTREND. When price closes above Supertrend Its bullish Momentum when its below Supertrend its Bearish Momentum. This indicator scans for candle closes on the current chart and when there is a shift in momentum (price closes below or above SUPERTREND) it notifies the trader with a Bar Color change.
Technical Inputs
- If you want to optimize the rate of signals to better fit your trading plan you would change the Factor input and ATR Length input. Increase factor and ATR Length to decrease the frequency of signals and decrease the Factor and ATR Length to increase the frequency of signals.
Quick TIP! : You can Sync all VFX SuperTrend Indicators together! All VFX SuperTrend indicators display unique information but its all derived from that same Momentum Formula. Keep the Factor input and ATR Length the same on other VFX SuperTrend indicators to have them operating on the same data.
Display Inputs
- The indicator has a candle overlay option you can toggle ON or OFF. If toggled ON the candles color will represent the momentum of your current chart ( bullish or bearish Momentum)
your able to change the colors that represent bullish or bearish to your preference
- You can toggle on which shows the exact candle momentum switched sides
your able to change the colors that represent a bullish switch or bearish switch to your preference
- The trader can specify which point you would like your stop loss to reference. (Low and High) Which uses the Low of the Momentum signal as the reference for your Stop Loss during buy signals and the High as the reference during sell signals. Or (Lowest Close and Highest Close) which uses the Lowest Close of the Momentum signal as the reference for your Stop Loss during buys and the Highest Close as the reference during sells.
- The colors that represent your Stop Loses and Take Profits can also be changed
Risk Management Inputs
- Your Risk MANAGMENT section is used to set up how your Stop Loss and Take Profit are calculated
- You have the option to take in account Volatility when calculating your Stop Loss. A adjusted ATR formula is used to achieve this. Increase Stop Loss Multiplier from 0 to widen stops.
- Increase Take Profit Multiplier from 0 to access visual Take Profit Levels based on your Stop Loss. This will be important for traders that Prefer trading using risk rewards. For Example: If the the Take Profit Multiplier is 3 a Take Profit level 3 times the size or your stop loss from your entry will be shown and a price number corresponding to that Take Profit Level becomes available.
- Enter your current Account size, Bet Percentage and Fixed Spread to get your Position Size for each trade
-Toggle on the Current Trade Chart and easily get the size of your Position and the exact price of your Take Profit and Stop Loss.
You can increase the Size of the Current Trade Chart= Tiny, Small, Normal, Large, Huge and change the Position of the Current
trade Chart to your preference, (Top- Right, Center, Left) (Middle- Right, Center, Left) (Bottom- Right, Center, Left).
How it can be used ?
- Enter Trades and always know where your stop is going to be
- Eliminate the need to manual calculate Position Size
- Get a consistent view of the current charts momentum
- Systematical enter trades
- Reduce information overload

3Commas dollar cost averaging (DCA) QFL IndicatorAs investors, we often face the dilemma of willing high stock prices when we sell, but not when we buy. There are times when this dilemma causes investors to wait for a dip in prices, thereby potentially missing out on a continual rise. This is how investors get lured away from the markets and become tangled in the slippery slope of market timing, which is not advisable to a long-term investment strategy.
Skyrex developed a complex indicator based on dollar-cost averaging in Quick Fingers Luc's interpretation. It is a combinations of strategies which allows to systematically accumulate assets by investing scaled amounts of money at defined market cycle global support levels. Dollar-cost averaging can reduce the overall impact of price volatility and lower the average cost per asset thus even during market slumps only a small bounce is required to reach take profit.
The indicator script monitors a chart price action and identifies bases as they form. When bases are reached the script provides entry alerts. During price action development an asset value can go lower and in this way the script will perform safety entries alerts at each subsequent accumulation levels. When weighted average entry price reaches target profit the script will perform a take profit action alert.
Bases are identified as pivot lows in a fractal pattern and validated by an adjustable decrease/rise percentage to ensure significancy of identified bases. To qualify a pivot low, the indicator will perform the following validation:
Validate the price rate of change on drops and bounces is above a given threshold amount.
Validate the volume at the low pivot point is above the volume moving average (using a given length).
Validate the volume amount is a given factor of magnitude above is above the volume moving average.
Validate the potential new base is not too close to the previous range by using a given price percent difference threshold amount.
A fractal pattern is a recurring pattern on a price chart that can predict reversals among larger, more chaotic price movements. These basic fractals are composed of five or more bars. The rules for identifying fractals are as follows:
A bearish turning point occurs when there is a pattern with the highest high in the middle and two lower highs on each side.
A bullish turning point occurs when there is a pattern with the lowest low in the middle and two higher lows on each side.
Basic dollar-cost averaging approach is enhances by implementation of adjustable accumulation levels in order to provide opportunity of setting them at defined global support levels and Martingale volume coefficient to increase averaging effect. According to Quick Fingers Luc's principles trading principles we added volume validation of a base because it allows to confirm that the market is resistant to further price decrease.
The indicator supports traditional and cryptocurrency spot, futures , options and marginal trading exchanges. It works accurately with BTC , USD, USDT, ETH and BNB quote currencies. Best to use with 1H timeframe charts and limit orders. The indicator can be and should be configured for each particular asset according to its global support and resistance levels and price action cycles. You can modify levels and risk management settings to receive better performance
The difference between core script and this interpretation is that this strategy is specially designed for 3Commas bots
How to use?
1. Apply indicator to a trading pair your are interested in using 1H timeframe chart
2. Configure the indicator: change layer values, order size multiple and take profit/stop loss values according to current market cycle stage
3. Set up a TradingView custom alert using the indicator settings to trigger on a condition you are interested in
4. The indicator will send alerts when to enter and when to exit positions which can be applied to your portfolio using external trading platforms
5. Update settings once market conditions are changed using backtests on a monthly period